Demo City Fiber — User Manual
Fiber asset and splice management: map, search, splice editor, end-to-end trace, OTDR results, A → Z dark fiber, reservations, circuits, open conduit, reports and data health.
Every name, address and record in the Demo City Fiber network is invented. Search this manual with the box at the top left (press /); press ? in the application to open it.
Introduction and concepts
This chapter explains what the application is for and the network concepts it is built on. If you already work with outside-plant fiber records, skim the tables and go to .
About this manual
The manual follows the layout of the application: a chapter for each sidebar tab and dialog, followed by keyboard shortcuts, administration, the data model and import, troubleshooting and a glossary.
| Convention | Meaning |
|---|---|
| Connect | A button, tab, menu item, field or other label exactly as it appears on screen. |
| C, Ctrl+Z | A key or key combination. |
PD-WT.144A #37 | Data values, labels, file names, settings and commands. |
| Search › Location card | A path through the interface. |
| Numbered steps | A procedure. Do the steps in order. The text after the steps describes the result. |
NoteNotes give extra information that helps you understand a feature.
TipTips are shortcuts and better ways of doing a task.
CautionCautions warn about actions that change or discard data, or break a working circuit.
What the application does
The Fiber Manager keeps the physical fiber plant of a city, utility, ISP or campus in one place and lets you work with it on a map:
- Map of facilities, cabinets, manholes and handholes, conduit colored by how full it is, and fiber cables by type.
- Search by ID, name, address, street, cable, circuit or device, with location cards that show what is available at a site.
- Splice editor: two cables side by side, buffer tubes and fibers in TIA-598 colors, with drawn splice lines. Connect, disconnect, splice a tube or a whole cable straight across, undo, and trace any fiber.
- Trace of any fiber from end to end with a hop list, length, an estimated loss budget and the recorded OTDR or power-meter result.
- A → Z dark fiber search between two locations, and fiber reservations.
- Circuits, the open conduit finder, printable reports, CSV export and data health checks.
The installation described here is a demonstration loaded with the fictional Demo City Fiber network: 11 sites (8 facilities and 3 cabinets), 67 manholes and handholes, about 8.2 km of conduit, 14 cables with 924 fiber strands, 382 splices, 10 lit circuits and 1 reservation.
Structures
A structure is any place you can stand: a facility, a cabinet, a manhole or a handhole. Every structure is a point on the map with a label, a name and, for buildings, an address. Facilities and cabinets also have a short site code (for example CH for City Hall or WT for the North Water Tower POP). Site codes are used in cable labels.
| Type | Description | Example |
|---|---|---|
| Facility / POP | A building with racks, splice enclosures, patch panels and active equipment. | CH Demo City Hall — Core POP |
| Cabinet | A street cabinet, such as a traffic signal or camera pole cabinet. | TS1, CM1 |
| Manhole | A below-grade vault on the conduit route. Labelled StreetCode.Block. | W2.350 |
| Splice point (manhole) | A manhole that holds a splice case and has its own site code. | MH7 (label W4.150) |
| Handhole | A smaller pull box on the conduit route. | — |
Inside a structure, equipment is nested: a rack holds splice enclosures and patch panels, and an enclosure holds splice trays. Active devices (routers, switches, media converters and so on) sit in racks. The location card lists all of them (see ).
Conduit and ducts
A conduit is one pipe or bundle between two structures. It has a material (for example HDPE or Schedule 40 PVC), a size in inches, a color, a placement (bore or trench) and a length. A conduit contains one or more ducts: innerducts or microducts identified by a position letter, such as CD-042.B. Each duct has a status: occupied, spare, reserved or damaged.
The fill of a conduit is the share of its ducts that are occupied. The map colors every conduit by fill:
| Color | Fill |
|---|---|
| Green | Empty: no duct is occupied. |
| Yellow | Partly used: some ducts are occupied, under 60 %. |
| Orange | Busy: 60 % or more of the ducts are occupied, at least one is free. |
| Red | Full: no spare duct is left. |
| Dashed | Planned conduit (designed, not built). |
Cables
A cable runs from its A end structure to its Z end structure through a sequence of conduit ducts called spans. Its length includes slack loops left in manholes. Cables are labelled A-Z.FiberCount+Letter, where the letter tells parallel cables apart: WT-WP.96A is the first 96-fiber cable from WT to WP.
| Type | Use | Fiber counts in the demo | Map symbol |
|---|---|---|---|
| Backbone | The ring between facilities. | 96–144 | Thick blue |
| Distribution | Branches from the ring to sites and splice points. | 24–48 | Cyan |
| Drop | The last run to a cabinet or a single building. | 12 | Thin violet |
Buffer tubes, strands and TIA-598 colors
The fibers in a cable are grouped in buffer tubes, usually 12 fibers per tube. Tubes and fibers are colored with the TIA-598 standard, in this order:
| # | Color | Code | # | Color | Code |
|---|---|---|---|---|---|
| 1 | Blue | BL | 7 | Red | RD |
| 2 | Orange | OR | 8 | Black | BK |
| 3 | Green | GR | 9 | Yellow | YL |
| 4 | Brown | BR | 10 | Violet | VI |
| 5 | Slate | SL | 11 | Rose | RS |
| 6 | White | WH | 12 | Aqua | AQ |
A single fiber is a strand. Strands are numbered 1 to the fiber count of the cable, and the number is what identifies the strand. Tube and fiber color are worked out from the number:
- tube = the strand number divided by fibers per tube, rounded up;
- fiber in the tube = the remainder, counting from 1.
With 12 fibers per tube, strand 37 is tube 4 (Brown), fiber 1 (Blue). The application shows it as PD-WT.144A #37, with the long form (tube 4 Brown / fiber 1 Blue) and the short code BR.BL (tube code, then fiber code). BL.OR is strand 2 and OR.BL is strand 13.
NoteColor codes such as BL.OR are for display only. Records always refer to a strand by cable and number, so a strand keeps its identity even if a different color standard is shown.
Splices, terminations and jumpers
Where cables meet inside a structure, fibers are joined in a splice tray inside a splice enclosure. Each join is a splice (a connection) between one strand of one cable and one strand of another. A splice is usually fusion; mechanical splices are also recorded. Splices can carry the measured splice loss, the date and the technician.
A termination puts a strand on a port of a patch panel. A jumper (patch cord) connects a patch-panel port to a port on a device, such as CH-CORE-01 Te1/0/1.
The rule that keeps the records consistent: at any one structure, each end of a strand has at most one splice or termination. The splice editor enforces this as you work (see ).
A splice where a fiber simply continues to the next cable, without being dropped at that site, is called an express splice. Express splices matter when you reserve dark fiber (see ).
Circuits and reservations
A circuit is a service carried on one or more strands, usually a transmit/receive pair. It is labelled CKT-### and has a name, a service type (for example SCADA, Public safety LAN, Internet transit), a bandwidth and an owner. Its status is one of:
- lit — in service, shown in green;
- reserved — fibers held for a future use until a hold-until date, shown in amber.
The data model also knows the statuses planned and decommissioned; the demo network uses lit and reserved. A circuit stores only its starting strands at the A end. The path itself is never typed in: it is found by tracing, so it always matches the splices on record.
Fibers that carry no circuit are dark. A reservation is a circuit with status reserved, created from the A → Z search (see ).
Traces and the loss budget
A trace follows a strand from splice to splice in both directions until it reaches a patch-panel termination, an open (unspliced) end, or a loop. The result is the list of cables, splices and end points the light passes through, the total length, and an estimated loss:
estimated loss = length (km) × fiber loss (dB/km)
               + fusion splices × fusion splice loss
               + mechanical splices × mechanical splice loss
               + connector pairs × connector pair loss
The assumptions are part of the network data and are always shown with the result. For Demo City Fiber they are:
| Assumption | Value |
|---|---|
| Wavelength | 1310 nm |
| Fiber attenuation | 0.35 dB/km |
| Fusion splice | 0.1 dB each |
| Mechanical splice | 0.3 dB each |
| Connector pair | 0.5 dB each (one for every end that lands on a patch panel) |
A measured OTDR or power-meter result, when recorded, is shown next to the estimate (see ).
Verified and unverified records
Every record carries where it came from and how much it can be trusted:
| Field | Values | Meaning |
|---|---|---|
| Lifecycle | planned, as-built, abandoned | Designed but not built; built; kept for history only. Abandoned conduit is ignored by the open conduit finder. |
| Confidence | verified, unverified, estimated | Field-checked; imported but not checked; derived (for example a straight-line conduit drawn between two structures). |
| Source | text | Where the record came from, for example legacy-spreadsheet or web-editor. |
| Updated | date · user | When and by whom the record was last changed. |
On the map, a structure that is not verified has a dashed amber outline. Detail cards show a green verified pill or an amber unverified · source pill, and the identify popup adds unverified after the type. The Q1 data health check lists every unverified structure as a field-verification work list (see ). In the demo, NBUR.100A and W6.550 are unverified records from a legacy spreadsheet.
Splices you make in the splice editor are saved with lifecycle as-built, source web-editor and confidence verified.
Getting started
This chapter covers opening the application, the parts of the screen, roles, and how your changes are kept.
Opening the application
The application is a set of web pages. Open index.html in a current browser (Microsoft Edge, Google Chrome, Firefox or Safari), either from the web address your administrator gives you or straight from a folder on disk.
While it loads, the map is empty. When the network data has loaded, the map draws the network and the sidebar shows network statistics.
NoteThe browser needs internet access to load the map library (OpenLayers, from cdn.jsdelivr.net) and the basemap tiles (from server.arcgisonline.com). Without the map library the map shows The map library could not load (offline?). Reload when connected. Closed networks can host both locally; see .
The screen layout
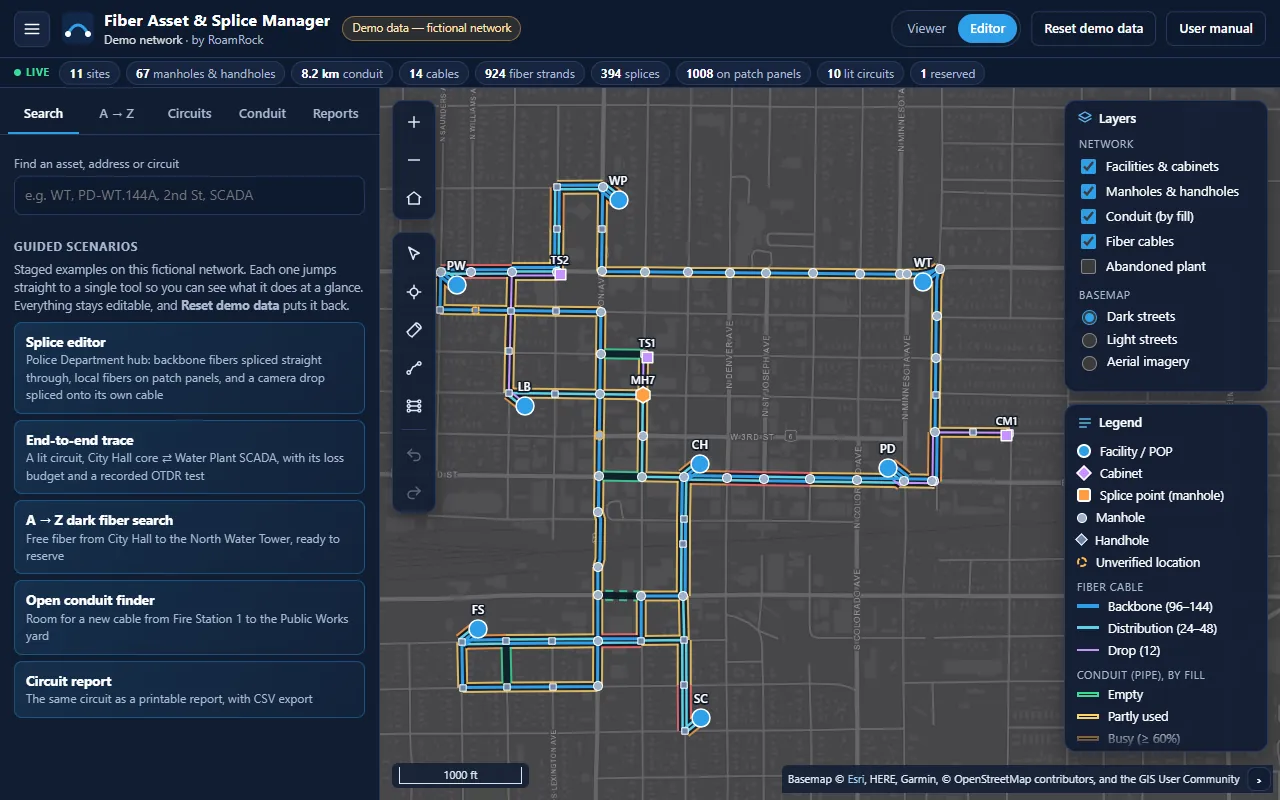
Dialogs open over the main window for the splice editor, reports and the reservation form.
The top bar

Roles: Viewer and Editor
There are two roles:
- Viewer can see and search everything, trace fibers, run reports, export CSV and run data health checks.
- Editor can also change splices, reserve and release fiber, and save OTDR results.
To switch roles in the demo
- In the top bar, click Viewer or Editor.
The highlighted button shows the current role. The choice is remembered in this browser.
As a Viewer, editing buttons are disabled: Connect, Disconnect, Tube straight across, All straight across and Undo in the splice editor (which also shows Viewer: read-only), Reserve… in A → Z results, Release reservation, and the OTDR form. If a change is attempted anyway, the message Viewer role: switch to Editor to make changes. appears.
The live totals banner and guided scenarios
A slim banner under the top bar shows the network's totals. It is always visible and updates the moment anything changes: a total that changed flashes briefly. Click lit circuits or reserved to list those circuits in the Circuits tab. On a narrow screen, swipe the banner sideways to see every total.
| Total | Counts |
|---|---|
| sites | Structures with a site code, except splice-point manholes. |
| manholes & handholes | All other structures. |
| conduit | Total conduit length in km. |
| cables / fiber strands | Number of cables and the sum of their fiber counts. |
| splices | All splices on record. |
| on patch panels | All patch-panel terminations on record. |
| lit circuits / reserved | Circuits by status. |
When the search box is empty, the Search tab shows the guided scenarios.
The Guided scenarios are staged examples on the fictional demo network. Each one jumps straight to a single tool, already set up, so you can see what it does at a glance. They are starting points, not limits: everything they open stays fully editable, and Reset demo data puts the network back.
| Scenario | What it opens |
|---|---|
| Splice editor | The splice editor at the Police Department (PD) hub: backbone fibers spliced straight through, local fibers on patch panels, and a camera drop spliced onto its own cable. |
| End-to-end trace | CKT-001, City Hall core ⇄ Water Plant SCADA, with loss budget and a recorded OTDR test. |
| A → Z dark fiber search | Dark fiber routes from City Hall (CH) to the North Water Tower POP (WT), ready to reserve. |
| Open conduit finder | Open conduit from Fire Station 1 (FS) to the Public Works yard (PW). |
| Circuit report | The printable report for CKT-001, with CSV export. |
The demo network is deliberately conventional so the tools read clearly: backbone fibers splice straight across, each cable lands on its own patch panel with port N carrying fiber N, and only a handful of simple exceptions exist. shows how the tool handles messier, real-world splicing.
Saving your work and resetting the demo data
In the demo there is no Save button: every change is saved as soon as you make it, in this browser's local storage. That includes splices, reservations, released reservations and OTDR results. When you open the application again in the same browser, the message Restored your saved demo edits. Use “Reset demo data” to start over. confirms that your changes were loaded.
To reset the demo data
- In the top bar, click Reset demo data.
- Read the confirmation Reset the demo? This discards your splices, reservations and OTDR entries in this browser. and click OK.
The original network is reloaded, the map highlight is cleared, the Search tab opens and the message Demo data reset to the original network. appears.
CautionReset cannot be undone. Your changes are also lost if you clear the browser's site data, and they are not shared with other browsers or other people. If the browser blocks storage (some private windows do), the message Browser storage is blocked: edits will last until you reload. appears.
NoteSaved changes belong to one version of the network data. When the administrator publishes a new network file, saved demo changes made against the old file are not loaded.
Using the application on a phone or tablet
On screens narrower than 760 pixels the sidebar becomes a bottom sheet with three heights: peek (just the handle and the tab names, so most of the screen is map), half and full (up to just below the top bar).
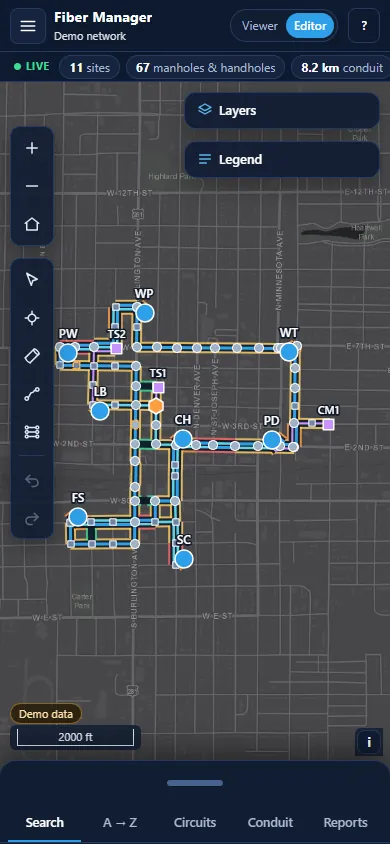
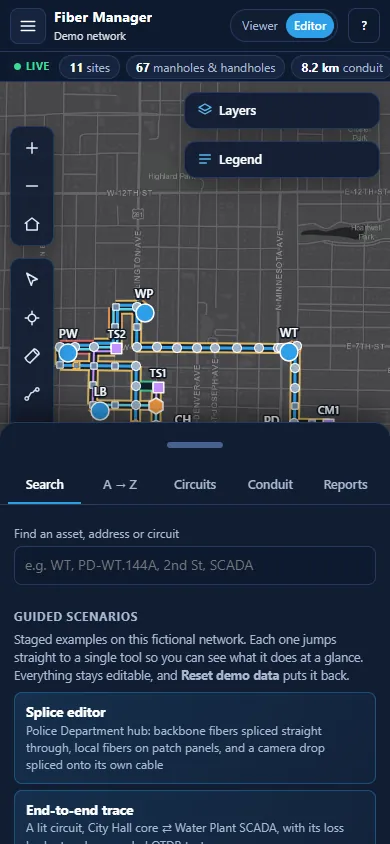
- Drag the sheet by its handle or its tab strip to any height; it settles on the nearest of the three. A quick flick moves it one step.
- Tap the handle to step through peek, half and full. Tapping a tab while the sheet is at peek opens it to half; opening a detail card does the same.
- While an edit tool is on, the sheet steps aside and the tool's own panel takes its place at the bottom: compact at first (the title, the one control you need, and Cancel / Done), with the chevron in its title bar to show every option. Hints say tap and double-tap on a touch screen.
- The ☰ button opens a menu with the panel, Reset demo data and the user manual.
- The Legend starts collapsed; tap it to open.
- The splice editor and reports fill the whole screen. The fiber color codes and the keyboard hint are hidden to save room, and the splice editor's How to use folds into one row at the bottom: tap it to read it.
Map navigation
The map shows the network on a basemap. You can move around it, choose what is drawn, and click any feature to identify it.
Panning and zooming
| To | Do this |
|---|---|
| Pan | Drag the map with the mouse, or drag with one finger. |
| Zoom in or out | Turn the mouse wheel, click + or − at the top left, or pinch on a touch screen. |
| Zoom in one step | Double-click the map. |
| Zoom to a box | Hold Shift and drag a rectangle. |
| See the whole network | Click the home button (house icon) under the zoom buttons. |
The map is limited to zoom levels 11 to 20, which keeps you within reach of the network. Facility and cabinet labels are always shown; manhole labels appear as you zoom in.
Home, scale bar and attribution
The home button (tooltip Zoom to whole network) fits the whole network in view. The scale bar at the bottom left shows distance in feet or miles. The attribution at the bottom right credits the basemap provider; on narrow screens it is collapsed behind a small button.
The Layers panel
Click Layers at the top right of the map to open or close the panel.
| Option | Shows |
|---|---|
| Network (check boxes, all on by default) | |
| Facilities & cabinets | Structures with a site code: facilities, cabinets and splice-point manholes. |
| Manholes & handholes | All other structures. |
| Conduit (by fill) | Conduit runs colored by fill. |
| Fiber cables | Cables colored by type. |
| Basemap (choose one) | |
| Dark streets | Dark gray street map (default). Best contrast for the network colors. |
| Light streets | A standard street map. |
| Aerial imagery | Satellite and aerial photos, slightly dimmed. |
TipTurn off Fiber cables to judge conduit fill on its own, or turn off Conduit (by fill) to see cable routes clearly. Highlights from traces and searches are drawn on top whatever the layer settings.
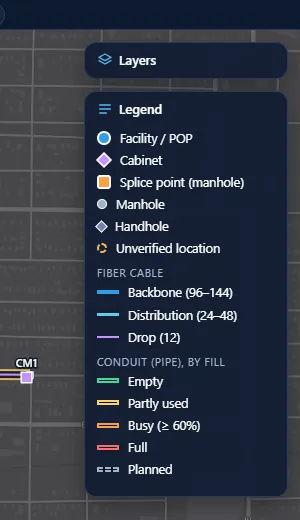
The Legend
Click Legend to open or close it. It is open by default on a computer and closed on a phone. It lists only what the map is showing: each section appears and disappears with its switch in Layers, and an Abandoned plant section appears when that layer is on. When it is longer than the space below Layers, it scrolls inside its panel, and the edge with more hidden behind it fades out: the bottom edge at first, the top edge once you have scrolled down.
| Symbol | Meaning |
|---|---|
| Blue circle | Facility / POP |
| Violet diamond | Cabinet |
| Orange hexagon | Splice point (manhole) |
| Small gray circle | Manhole |
| Small gray diamond | Handhole |
| Dashed amber outline | Unverified location |
| Blue / cyan / violet line | Fiber cable: Backbone (96–144), Distribution (24–48), Drop (12) |
| Green / yellow / orange / red band | Conduit fill: Empty, Partly used, Busy (≥ 60%), Full |
| Dashed band | Planned conduit |
| Short white tick across a conduit | Where a conduit run ends, shown only while the structure it ends on is hidden (Facilities & cabinets or Manholes & handholes off in Layers), so you can still tell one run from the next. |
Identifying features
Point at a feature to highlight it; the pointer changes to a hand. Click to identify it: a popup opens with a summary and buttons.
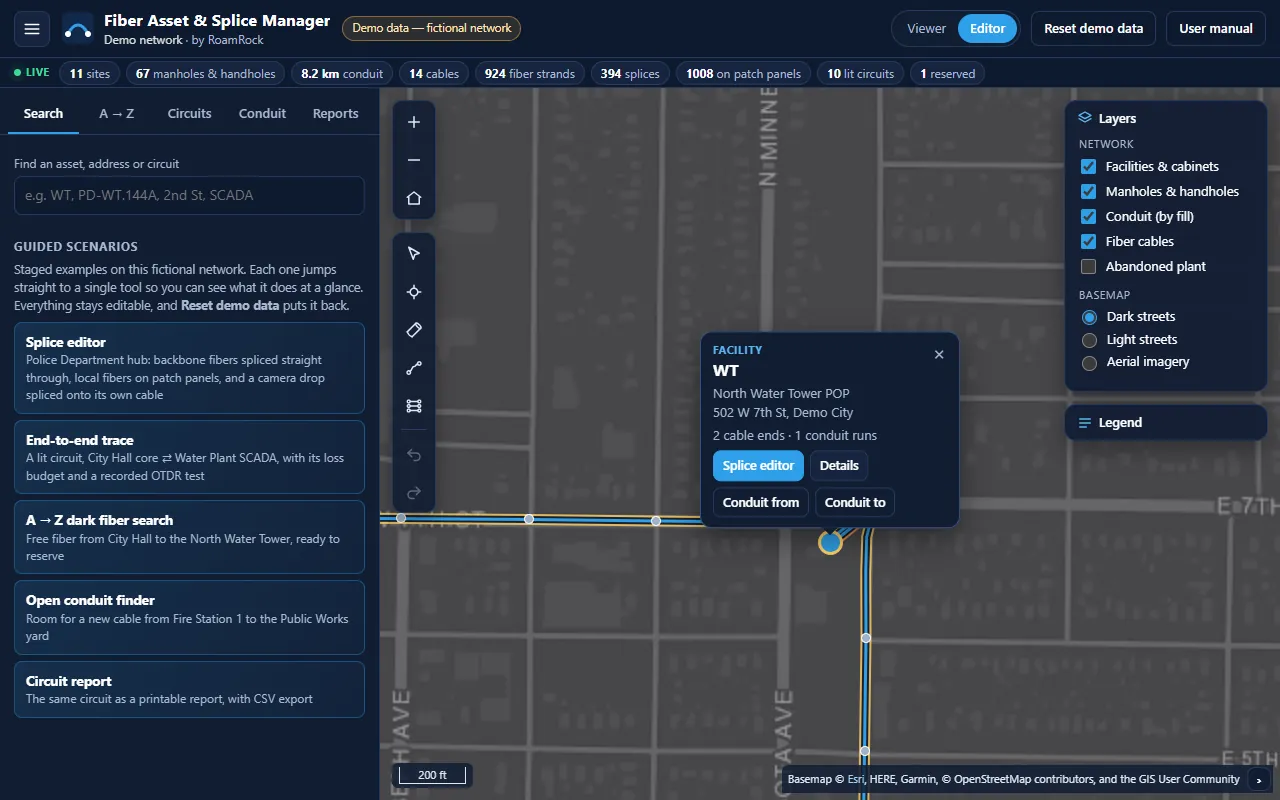
When several features overlap, the click picks in this order: facilities and cabinets, then manholes and handholes, then cables, then conduit. So clicking a manhole picks the manhole, not the cable passing through it. Zoom in to pick a line between structures.
| Feature | Shows | Buttons |
|---|---|---|
| Structure | Type (and unverified if so), label, name and address, number of cable ends and conduit runs. | Splice editor (only where there is a splice enclosure), Details, Conduit from, Conduit to |
| Cable | Type, label, fiber count, length, A → Z ends. | Fibers & route |
| Conduit | Label (and planned if so), material, size, length, ducts used and spare, cables inside or Empty conduit. | Ducts |
Close the popup with its × button or by clicking an empty part of the map.
Map highlights
Search results, traces and the finders draw a highlight on top of the network and zoom the map to it. End points are marked with yellow tags such as A · CH and Z · WP.
| Highlight color | Drawn by |
|---|---|
| Green | Trace of a lit circuit; open conduit segment with a free duct. |
| Amber | Trace of a reserved circuit. |
| Yellow | Trace of a dark fiber; the selected A → Z route. |
| Blue | The selected cable. |
| Red | Full conduit segment on the open conduit route. |
Click Back in a detail card to clear the highlight.
Search and location cards
Search finds any asset by what you know about it, and opens a detail card for it.
Searching
To find an asset, address or circuit
- Click the Search tab.
- Type in Find an asset, address or circuit. Results appear as you type.
- Click a result to open its detail card and zoom the map to it.
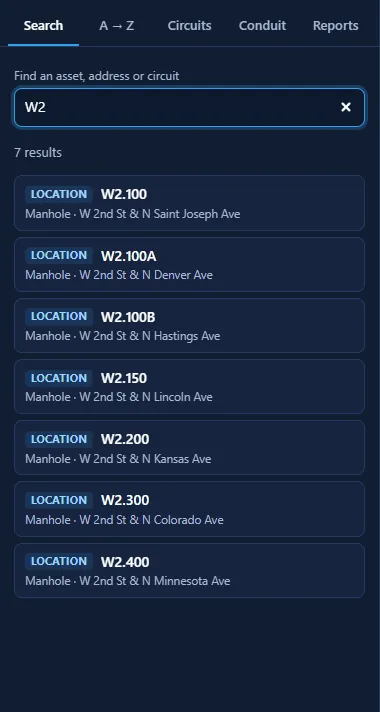
W2.Search matches any part of the text, ignoring upper and lower case, in these fields:
| Result tag | Searched fields | Opens |
|---|---|---|
| Location | Label, name, address, site code, street | Location card |
| Cable | Label, type (backbone, distribution, drop) | Cable card |
| Circuit | Label, name, service, status (lit, reserved) | Trace view of the circuit |
| Device | Label, name, type | Location card of the structure that houses it |
| Equipment | Label of a splice enclosure, splice tray or patch panel | Location card of its structure |
| Conduit | Label | Conduit card |
Exact label matches come first, then sites, cables and circuits, then other structures, devices, equipment and conduit. Up to 40 results are listed. If nothing matches, the panel suggests what to try: a site code (WT, CH), a cable label (PD-WT.144A), a manhole ID (W2.400), a street or a circuit name.
TipSearch a service to list its circuits (SCADA), a status to list all reservations (reserved), or a street name to list every structure on it (2nd St). Clear the box to return to the guided scenarios.
The location card
A location card describes one structure. Open it from search, from the Details button of an identify popup, or from a device or equipment result.
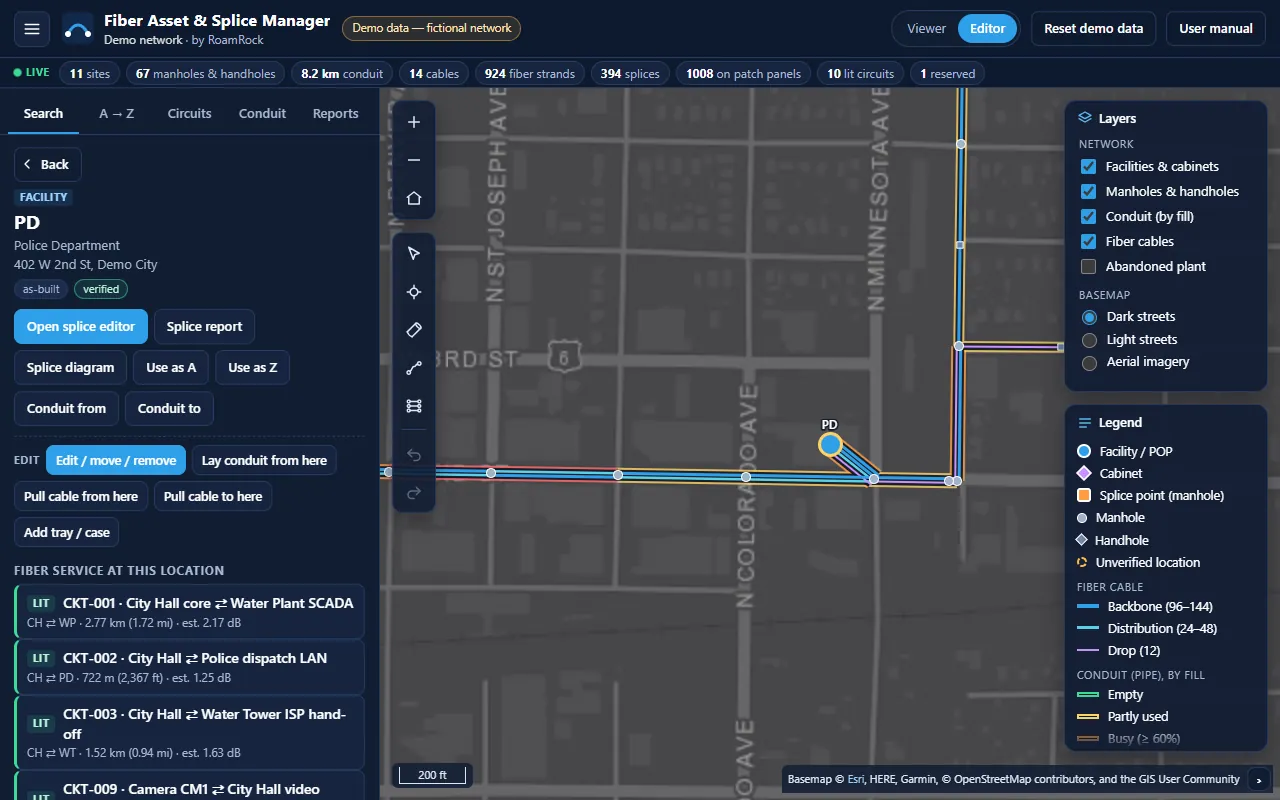
| Part | Description |
|---|---|
| Heading | Type tag, label, name and address, a lifecycle pill (for example as-built) and a verified or unverified · source pill. |
| Open splice editor | Opens the splice editor here. Only where the structure has a splice enclosure. |
| Splice report | Opens the splice tray report for this location. Only where there is a splice enclosure. |
| Use as A / Use as Z | Sets this site as Location A or Z and switches to the A → Z tab. Only for sites with a site code. |
| Conduit from / Conduit to | Sets this structure as the From or To structure and switches to the Conduit tab. |
| Fiber service at this location | Every circuit that starts, ends or is spliced here, with its ends, length and estimated loss. Click one to trace it. Shows No lit circuits here yet. where cables end but no circuit passes. |
| Fiber availability | One row per cable that ends here; see the table below. |
| Equipment | Racks (with size in U), the splice enclosure with each tray and its splice count (for example 18/24 splices), patch panels with ports used and connector type, and devices. |
| Record | Internal ID, source, confidence, last update (date · user), longitude and latitude, and lid size for manholes. |
| Column | Counts fibers that are… |
|---|---|
| Cable | The cable label. Click it to open the cable card. |
| Lit | On a lit circuit. |
| Res | On a reserved circuit. |
| Panel | Dark and terminated on a patch panel here: ready to patch. |
| Spliced | Dark and spliced through to another cable here. |
| Open | Dark and not spliced or terminated here. |
The cable card
Open a cable card from search, from Fibers & route in a cable popup, or from a cable link in another card. The map highlights the cable in blue with A and Z tags.
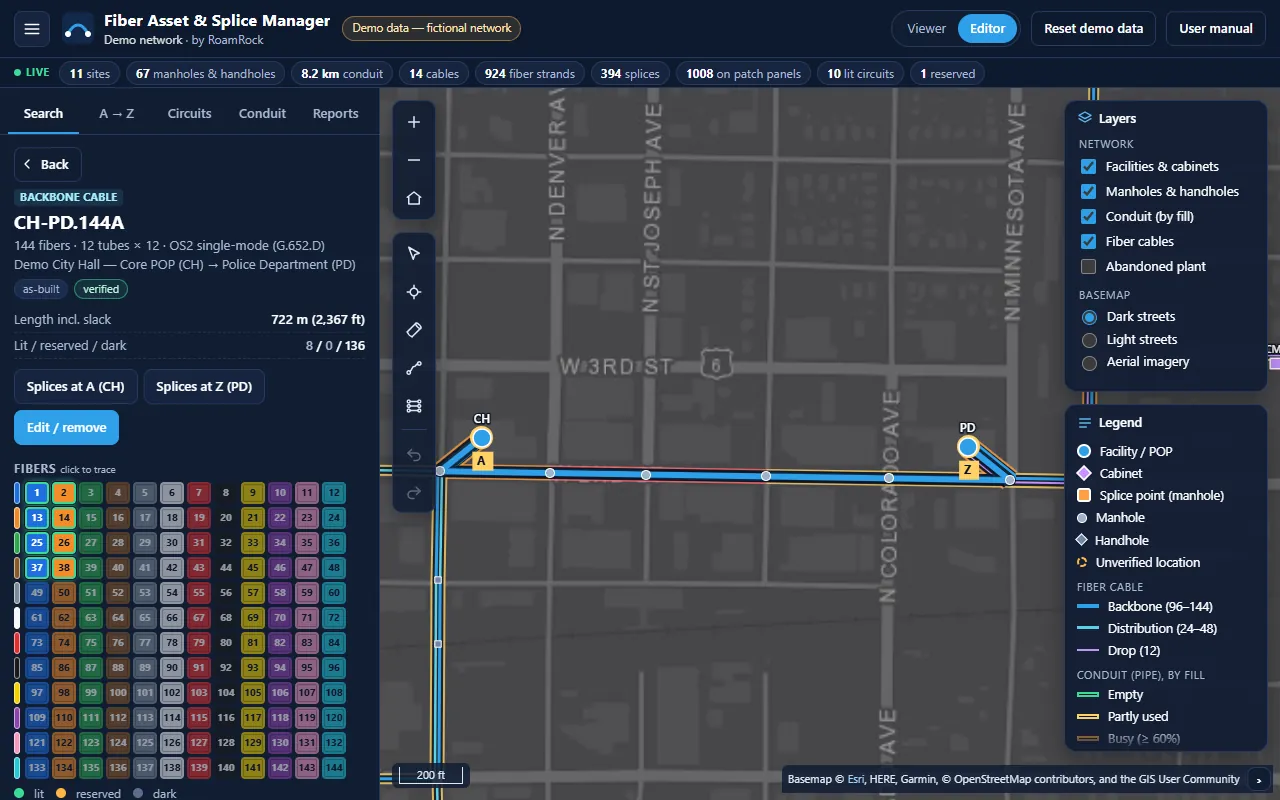
CH-PD.144A with its fiber grid.| Part | Description |
|---|---|
| Heading | Type, label, fiber count, tubes × fibers per tube, fiber type, A end → Z end, lifecycle and confidence pills. |
| Length incl. slack | Cable length in metres (and feet or miles), including slack loops. |
| Lit / reserved / dark | How many of the cable's fibers are in each state. |
| Splices at A (…) / Splices at Z (…) | Open the splice editor at either end of the cable. |
| Fibers click to trace | A grid with one row per buffer tube (tube color at the left) and one numbered chip per fiber in its fiber color. Lit fibers have a green glow, reserved fibers a dashed amber border, dark fibers are dimmed. Click a chip to trace that fiber. |
| Route — n spans | Each span in order: from → to, the duct used (click to open the conduit card), length in metres and slack. |
The conduit card
Open a conduit card from search, from Ducts in a conduit popup, from a duct link in a cable route, or from the open conduit finder.
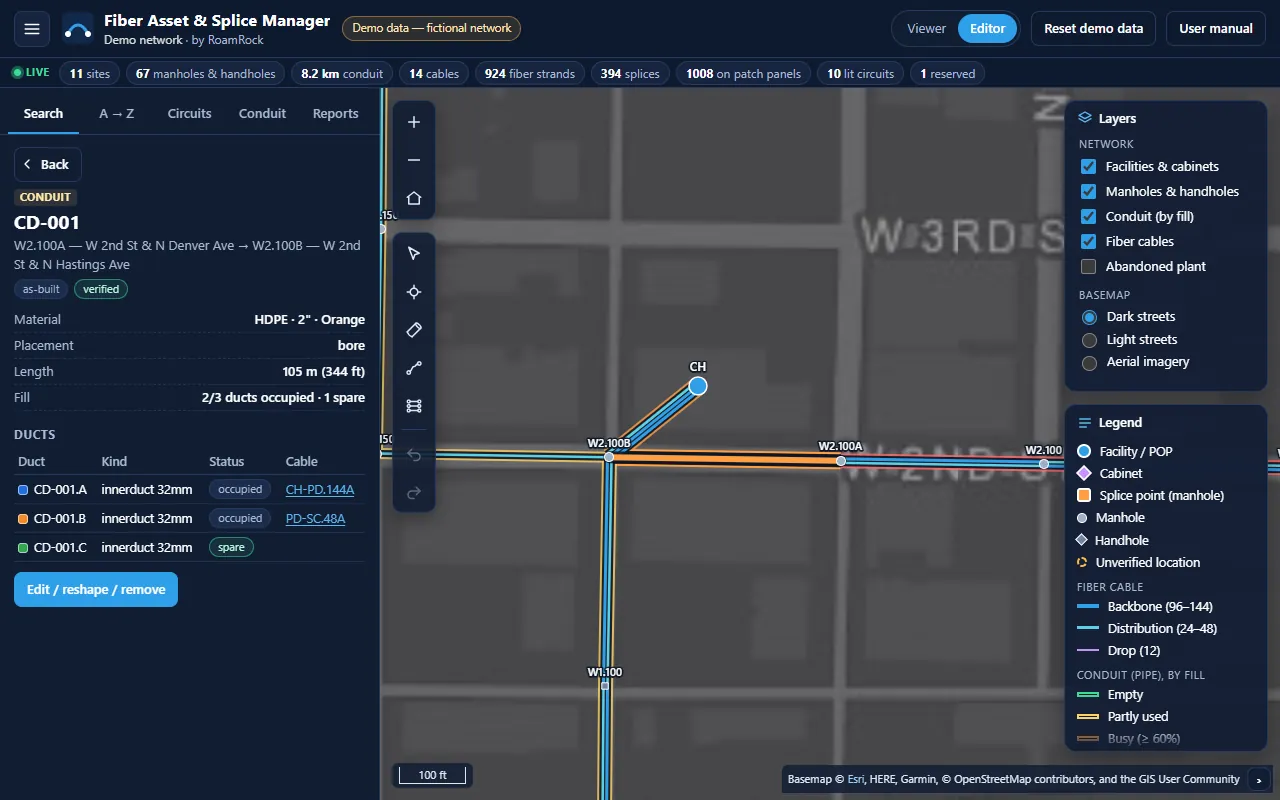
| Field | Description |
|---|---|
| Material | Material · size in inches · color. |
| Placement | How it was installed, for example bore or trench. |
| Length | Conduit length. |
| Fill | occupied/total ducts occupied · spare (and reserved, if any). |
| Ducts table | Each duct with its color swatch and label, kind and size in mm, status pill (spare in green, reserved in amber), and the cable in it (click to open) or what it is reserved for. |
Returning from a detail card
Click Back at the top of any detail card to return to the tab you were on. This also clears the map highlight. Detail cards refresh themselves when you edit splices, reserve fiber or save a test result, so the counts are always current.
Splice editor
The splice editor shows two cables side by side at one location, with every buffer tube and fiber in its TIA-598 color, and draws a line for every splice between them. You use it to record, change and check splices, and to trace any fiber from where you stand.
Opening the splice editor
The splice editor works at any structure with a splice enclosure (facilities, cabinets and splice-point manholes such as MH7). Open it from:
- the Splice editor button in a structure's identify popup;
- Open splice editor on a location card;
- Splices at A (…) or Splices at Z (…) on a cable card;
- the edit link on a splice in a trace, or Splices at End A under a trace (the traced fiber is selected for you);
- Splice editor under Guided scenarios (Police Department).
The editor opens on the pair of cables with the most splices between them, with the cable that starts at this location on the right, so it reads “in → out”. It opens at tube 1; use Go to tube… to jump further down. If no cable ends at a structure, the message No cables end at this structure. appears instead.
Close the editor with the × button at the top right or Esc.
The splice editor window
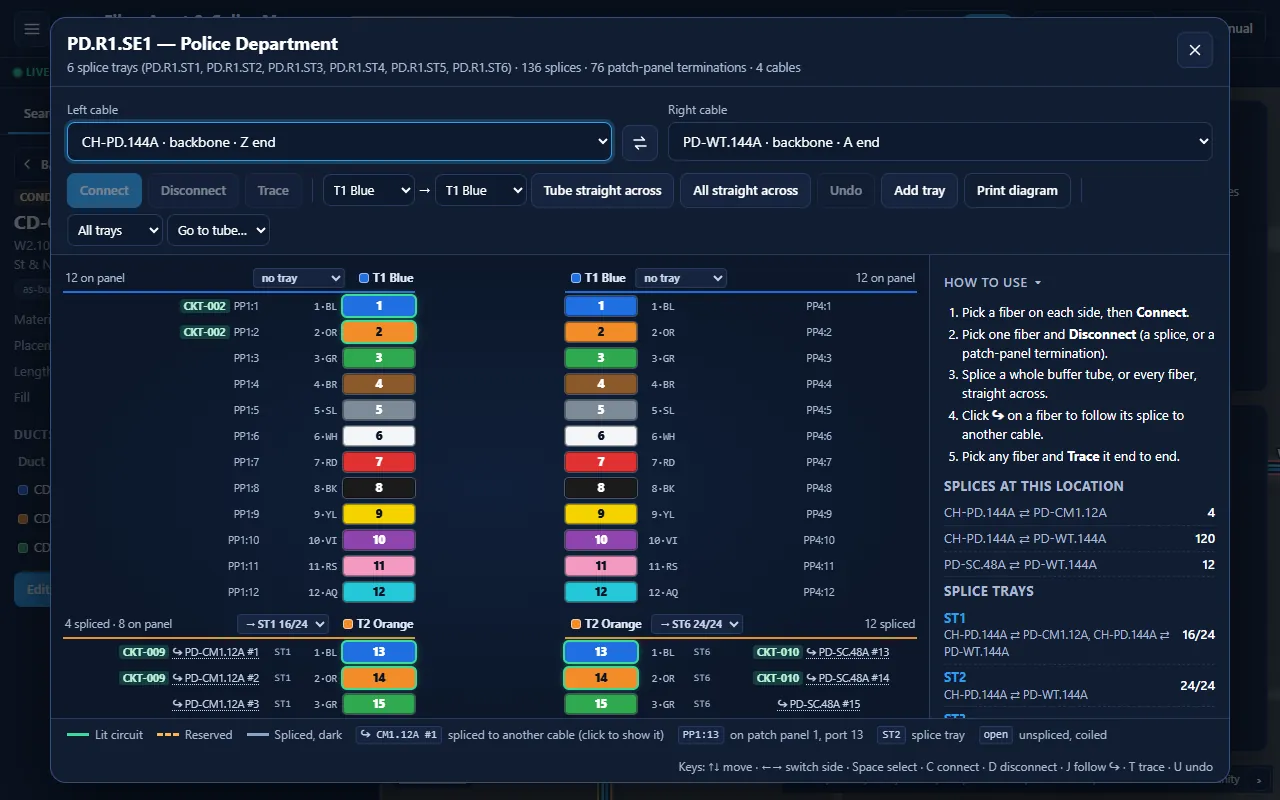
| Part | Description |
|---|---|
| Title | Enclosure label and location name, for example PD.R1.SE1 — Police Department. |
| Summary line | Number of splice trays (with their labels), splices, patch-panel terminations and cables at this location. |
| Left cable / Right cable | The two cables shown. Each option reads label · type · A end or Z end (which end of the cable is here). |
| Swap button (⇄) | Swaps the left and right cables. |
| Connect | Splices the selected left fiber to the selected right fiber (C). |
| Disconnect | Removes the splice on the selected fiber, or lifts it off its patch-panel port (D). |
| Trace | Closes the editor and shows the full trace of the selected fiber in the sidebar. |
| Tube selectors and Tube straight across | Pick a left tube and a right tube (for example T3 Green → T2 Orange) and splice the tube fiber for fiber. |
| All straight across | Splices every fiber to the fiber with the same number on the other cable. |
| Undo: … | Reverses your last change (U). The button names the change it will undo, for example Undo: Connect CH-PD.144A #40 ⇄ PD-WT.144A #40. |
| Add tray | Adds a 24-splice tray to the splice case here (or a splice case, if there is none). |
| Tube header tray list | The tray the tube is routed to, for example → ST3 16/24. Choose another to move the tube and its splices. |
| All trays list | Highlights the splices in one splice tray and dims everything else. Each option shows the tray and how full it is, for example ST3 · 24/24. |
| Go to tube… | Scrolls the board to a buffer tube. |
| Status line | Under the toolbar: the result of the last action, a warning, or a conflict (green, amber or red border). |
| Fiber board | Left cable fibers, splice lines, right cable fibers. Scrolls vertically. |
| Information panel | At the right (below the board on a phone). Shows How to use, the splice counts per cable pair and the splice trays with what each holds, or the selected fiber's details and live End A / End Z. |
| Footer | Legend for the lines (Lit circuit, Reserved, Spliced, dark) and the row badges (↪, PP1:13, ST2, open), and the keyboard keys. |
Reading the fiber board
Each side lists the cable's fibers grouped by buffer tube: a 144-fiber cable has 12 tubes of 12 fibers, in the same TIA-598 color order as the fibers inside them. Each tube starts with a header such as T2 Orange, underlined in the tube color, that says what its fibers do here, for example 4 spliced · 8 on panel or 12 spliced. A tube with no lines across is not unfinished work: its fibers are spliced to a different cable or land on a patch panel, and the header says which.
Each fiber row shows:
| Element | Meaning |
|---|---|
| Colored bar with number | The strand number in the whole cable (1–144) on a bar in the fiber's color. |
| Code | The fiber's position in its tube and its color, the way splicers name it: 1·BL is the first, blue fiber of the tube. |
| Tray | For a spliced fiber, the splice tray that holds the splice, for example ST3. |
| Circuit tag | The circuit on this fiber, for example CKT-005, green for lit or amber for reserved. |
↪ MH7-TS1.12A #1 | Spliced here to a fiber of a third cable that is not shown on the other side. Click it (or press J) to put that cable on the other side. |
PP2:26 | Terminated here on patch panel 2, port 26. |
| open | Not spliced or terminated here: coiled in the splice case for later use. |
| (no badge, a line) | Spliced to the fiber at the other end of the line. |
| Appearance | Meaning |
|---|---|
| Green glow on the bar, green line | Fiber on a lit circuit. |
| Amber outline and hatching, dashed amber line | Fiber on a reserved circuit. |
| Gray-blue line | Spliced, dark (no circuit). |
| Slightly thicker line crossing others | A crossed splice: strand numbers differ on the two sides (for example #13 → #1). |
| Blue highlight and outline on a row; white line | The selected fiber and its splice. |
| Row flashing red | This fiber blocked the last action (a conflict). |
| Faded rows and lines | Not in the splice tray picked in the All trays list. |
Hover over a fiber for a tooltip with its full description, for example MH7-LB.24A #13, tube 2 Orange, fiber 1 Blue, spliced to CH-MH7.48A #25.
Choosing the cables to show
To show a different pair of cables
- Choose a cable in Left cable.
- Choose a cable in Right cable.
- To put them the other way round, click the swap button (⇄) between the lists.
The board redraws with the new pair and any selection is cleared. If you choose the cable that is already on the other side, the two sides swap.
Where only one cable ends at a location, Right cable reads — only one cable here — and the board explains that its fibers are terminated on the patch panel. The tube and all-fiber buttons are then disabled.
TipWith nothing selected, the information panel lists Splices at this location for every cable pair, for example CH-MH7.48A ⇄ MH7-TS1.12A 4. Use it to find which pairs to look at. A ↪ badge also tells you which other cable a fiber goes to: click it to show that cable on the other side, with both fibers selected.
Under the cable pairs, Splice trays lists each tray with the cable pairs it holds and how full it is. Click a tray to highlight its splices on the board (the same as choosing it in the All trays list); click it again to show all trays.
Selecting fibers
Click a fiber to select it. You can have one selected fiber on each side. Click a selected fiber again to deselect it.
The information panel then shows the most recently selected fiber:
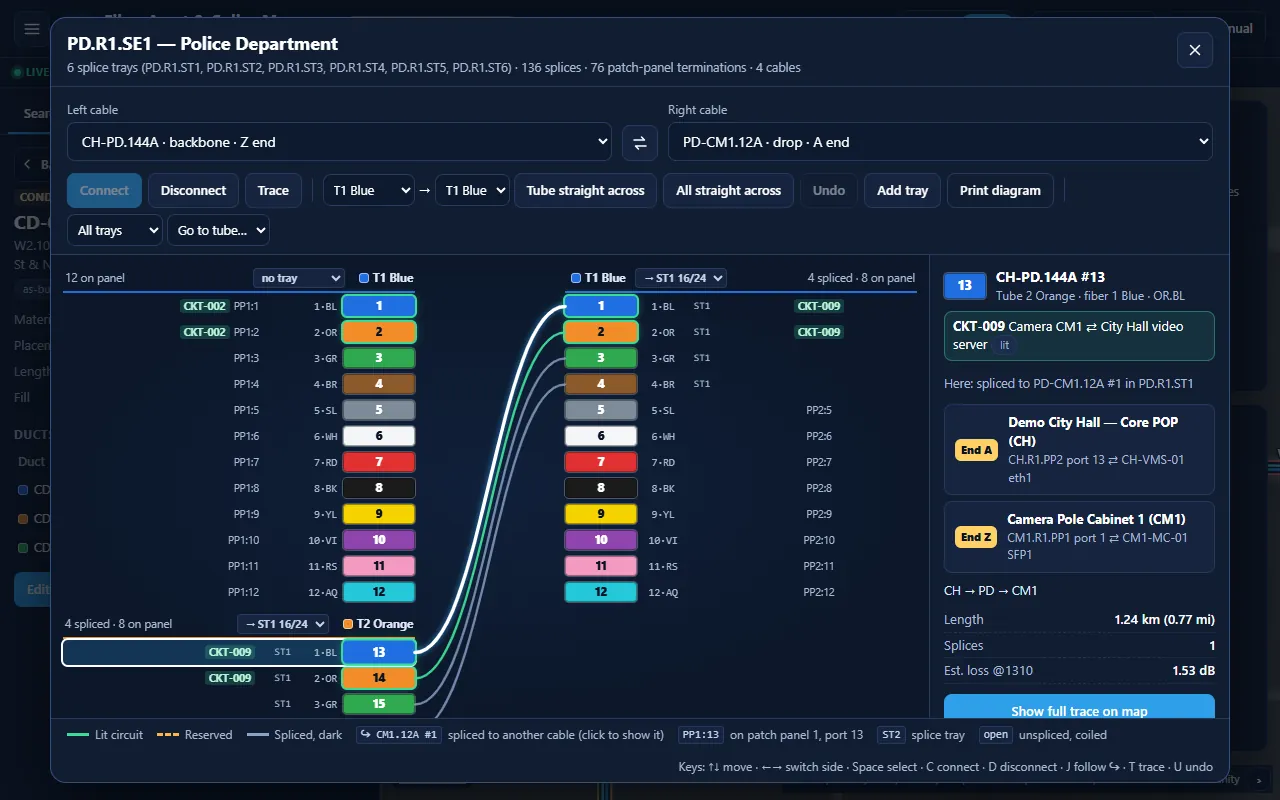
CH-PD.144A #13 selected: the crossed camera drop, with live End A / End Z.| Item | Description |
|---|---|
| Fiber heading | Strand label, tube and fiber colors and the code (for example Tube 2 Orange · fiber 1 Blue · OR.BL). |
| Circuit line | The circuit label, name and status, or Dark fiber — available. |
| Here | What the fiber is attached to at this location: spliced to … in (tray) (with show that cable when the other cable is not on screen), on … ⇄ device port with a Lift from patch panel button, or unspliced with a port list and Terminate button. |
| End A / End Z | Where the fiber ends in each direction after following all splices: a patch-panel port and the device port it is patched to, Unspliced / open end, or Loop detected. |
| Path | The locations the fiber passes through, for example CH → MH7 → LB. |
| Length, Splices, Est. loss @1310 | Totals for the whole traced path. |
| Show full trace on map | Closes the editor and opens the trace view (same as Trace). |
End A and End Z update instantly as you connect and disconnect, so you can check a change before you leave the editor.
Connecting two fibers
To splice two fibers
- Make sure you are in the Editor role.
- Click a fiber in the left cable.
- Click a fiber in the right cable. Connect becomes available when one fiber is selected on each side.
- Click Connect, or press C.
A line is drawn between the fibers and the status line reads, for example, Connected CH-MH7.48A #40 ⇄ MH7-LB.24A #20 on followed by the splice tray that holds the new splice. The selection is cleared so you can make the next splice.
To splice by dragging (mouse or pen)
- Press on a fiber's colored bar and drag toward the other cable. A dashed line follows the pointer.
- Move over a fiber on the other side. It glows green with a dashed outline when the splice is allowed, or red when it is not (the fiber is already spliced or terminated here).
- Release over the fiber. Press Esc while dragging to cancel.
A green drop makes the splice, exactly as Connect does. A red drop shows the conflict and changes nothing. Releasing anywhere else shows Not connected: drop the line on a fiber in the other cable. Near the top or bottom of the board, the board scrolls while you drag.
On touch screens, tap a fiber on each side and then Connect: the fiber rows are larger there, sized for a thumb.
New splices are recorded as fusion splices, dated today, with you as the technician. Each one goes on the tray its buffer tubes are routed to, adding a tray when needed and the case has room (see ).
If one of the fibers is already spliced or terminated here, nothing is changed: see .
Disconnecting a fiber
To remove a splice
- Click one of the two spliced fibers (either side).
- Click Disconnect, or press D or Delete.
- If a circuit runs through the splice, read the warning … runs through this splice. Disconnecting will break it. Continue? and click OK to go ahead or Cancel to keep it.
The line disappears and the status line reads Disconnected … ⇄ ….
CautionDisconnecting a fiber on a lit or reserved circuit breaks that circuit. The status line says so (CKT-005 is now broken — use Undo to restore.). Use Undo right away if this was a mistake.
A fiber that is neither spliced nor terminated here shows … is not spliced or terminated here.
Terminating a fiber on a patch panel
A fiber that lands in the building, rather than continuing on another cable, is terminated on a patch-panel port. You can move a fiber between the two.
To lift a fiber off its port
- Select a fiber with a
PP…badge. - Click Disconnect (or D), or Lift from patch panel in the information panel.
- If a circuit uses the fiber, confirm the warning.
The badge becomes open and the port is free. Any patch cord on the port stays in place, so terminating a fiber on that port later reconnects the device.
To terminate an open fiber
- Select a fiber marked open.
- In the information panel, choose a port in Terminate on a panel port. Free ports on the panel that serves this cable are listed first, starting with the port that matches the fiber number.
- Click Terminate.
The row shows the new PP… badge, and End A / End Z now stop at that port.
Both changes are single steps that Undo reverses.
Splicing a tube straight across
Splicing a whole buffer tube at once is the usual way to splice a branch cable into a ring. Fiber 1 of the left tube is joined to fiber 1 of the right tube, fiber 2 to fiber 2, and so on.
To splice a tube straight across
- In the toolbar, choose the left tube in the first tube list, for example T3 Green. You can also click a tube header on the left side of the board.
- Choose the right tube in the second list, for example T2 Orange, or click a tube header on the right side.
- Click Tube straight across.
The status line reports the result, for example Tube 3 Green → tube 2 Orange: 12 splices made.
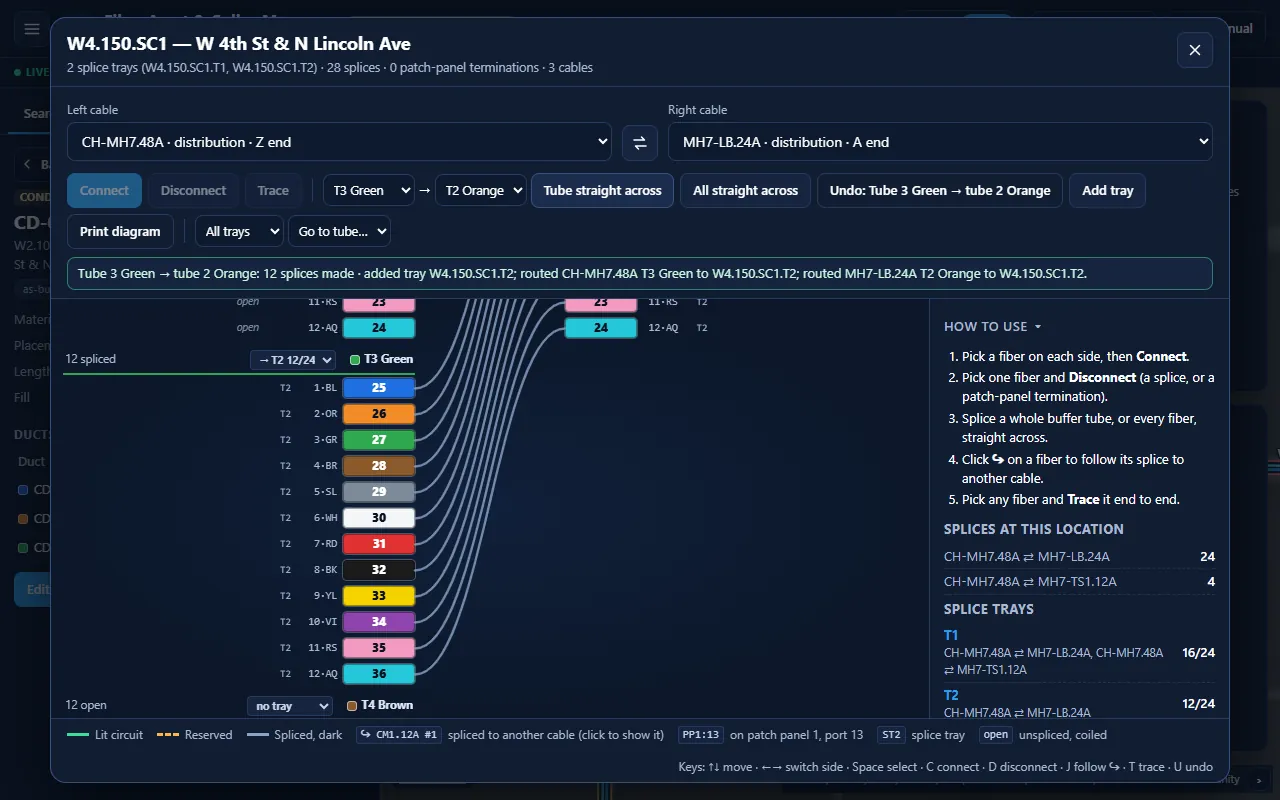
CH-MH7.48A spliced straight across to tube 2 Orange of MH7-LB.24A at MH7.Fibers that are already spliced or terminated are skipped, and the rest are spliced. The status line counts all three outcomes, for example All fibers straight across: nothing to change — 108 already straight across · 24 blocked because a fiber is spliced elsewhere or on a panel (flashing red). Blocked fibers flash red. Pairs already spliced to exactly the matching partner are counted as already straight across, not as blocked.
If the two tubes have a different number of fibers, only as many fibers as the smaller tube has are spliced.
Splicing all fibers straight across
To splice every fiber straight across
Fiber 1 is spliced to fiber 1, fiber 2 to fiber 2, and so on up to the smaller fiber count. Blocked fibers are skipped as with a tube. The status line reads All fibers straight across: n splices made…
TipA tube or all-fiber splice is one change: a single Undo removes all the splices it made.
Conflict checks
Every change is checked before it is made. A strand end can have only one splice or termination at a location, so Connect is refused when:
- both fibers are in the same cable (Both fibers are in the same cable.);
- a fiber is already spliced here (… is already spliced to ….);
- a fiber is terminated on a patch panel here (… is terminated on ….).
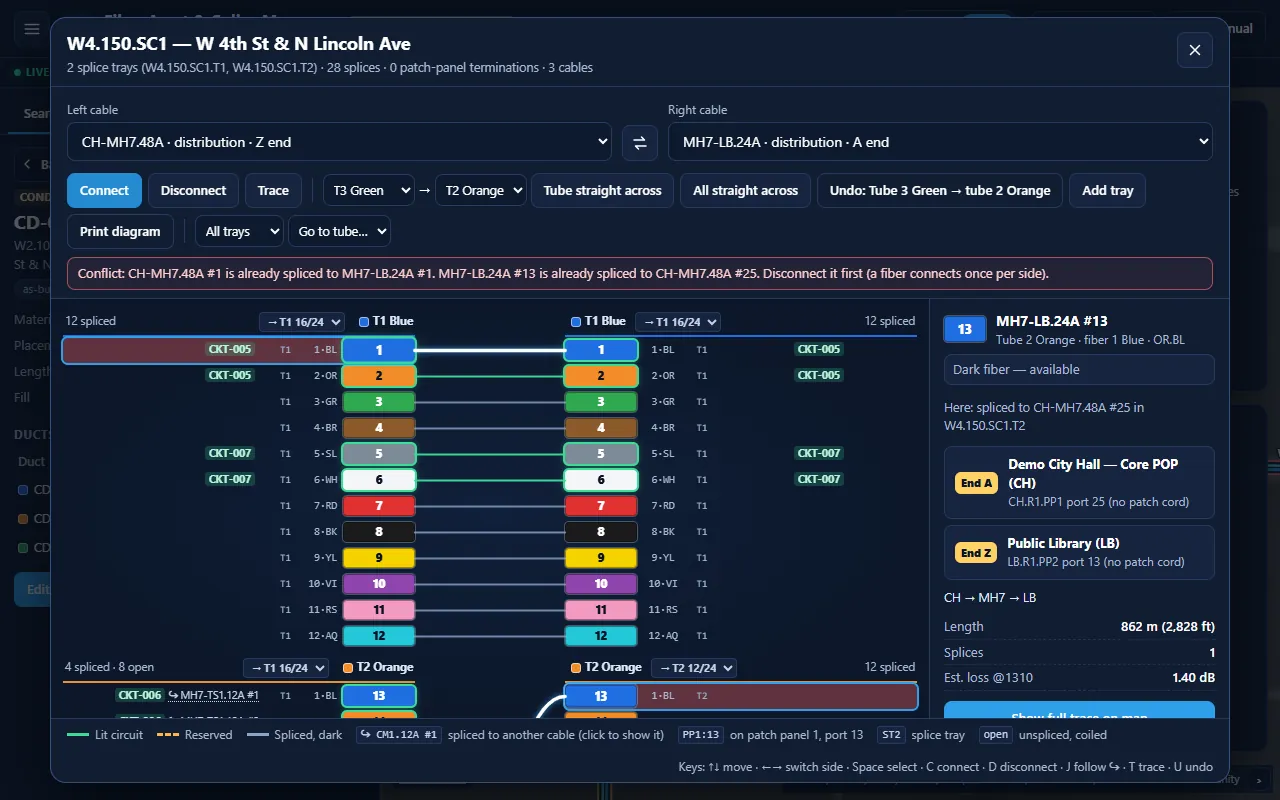
The status line turns red, starts with Conflict: and ends with Disconnect it first (a fiber connects once per side). Both fibers flash red. Nothing is saved.
To move a splice to a different fiber
- Select the fiber whose splice you want to move and click Disconnect.
- Select the left and right fibers you want to join.
- Click Connect.
Undo
Click Undo or press U (or Ctrl+Z) to reverse the last change. The button itself names that change before you click, for example Undo: Tube 3 Green → tube 2 Orange, and the status line confirms what was undone. You can undo repeatedly, back to the first change of the session.
Undo covers every change: splices, terminations, circuits, and everything built, edited, moved, abandoned or deleted with the edit toolbar, wherever in the application you made it. The edit toolbar also has Redo. It does not cover OTDR results.
NoteThe undo history lasts until you reload the page. Your changes themselves stay saved after a reload; only the ability to undo them step by step is lost.
Tracing from the splice editor
Select any fiber and the information panel shows its End A and End Z at once. Press T to refresh the panel for the last selected fiber without leaving the editor.
Using the keyboard
The splice editor can be used entirely from the keyboard. Each fiber column is a single Tab stop; inside it, use the arrow keys.
| Key | Action |
|---|---|
| ↑ ↓ | Move to the previous or next fiber in the same column. |
| ← → | Move to the fiber in the same row of the other column. |
| Home End | Move to the first or last fiber in the column. |
| Space or Enter | Select or deselect the focused fiber. |
| C | Connect the selected fibers. |
| D or Delete | Disconnect the selected fiber's splice, or lift it off its patch-panel port. |
| J | Follow the selected fiber's ↪ splice: show the other cable on the other side. |
| T | Show the selected fiber's trace in the information panel. |
| U or Ctrl+Z | Undo. |
| Esc | Close the splice editor. |
The letter keys do nothing while a cable or tube list has focus, so you can type to pick from a list.
The splice editor for viewers
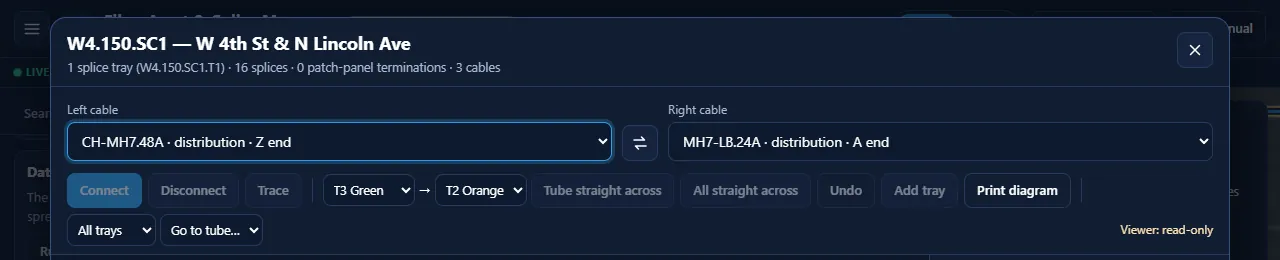
Viewers can open the editor, change the cables shown, select fibers, read End A / End Z and use Trace. Connect, Disconnect, Tube straight across, All straight across and Undo are disabled. Editing keys show Viewer role: switch to Editor (top right) to change splices.
Real-world splicing: worked examples
The demo network is kept simple on purpose. Real plant is rarely that tidy: decades of repairs, re-feeds and contractors leave crossed fibers, tubes that change color between cables, and fibers that split off in the middle of a tube. The model handles all of it the same way, because every splice is a record that joins exactly one strand to another, and every path is traced from those records rather than typed in. These examples show how.
1. A drop cable spliced onto a different tube
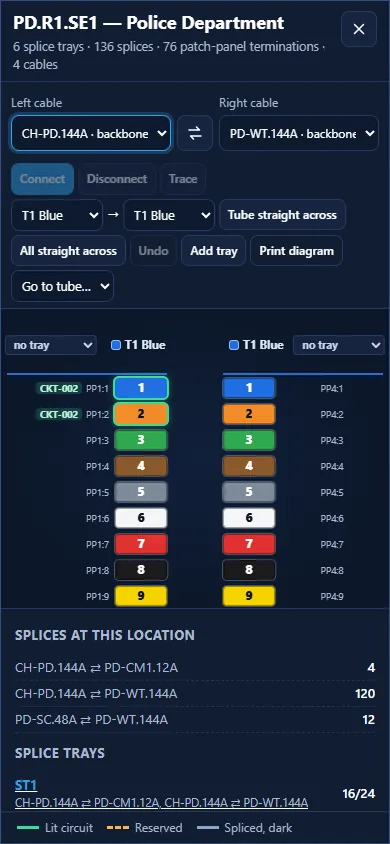
In the demo: at the Police Department, fibers 13–16 of CH-PD.144A (tube 2, orange) are spliced to fibers 1–4 of the camera drop PD-CM1.12A (tube 1, blue). Branch cables almost always start at tube 1, so the color changes at the splice.
How the tool shows it: with both cables on screen, the four lines cross from orange to blue and are drawn slightly thicker. With another cable on the right, the rows read ↪ PD-CM1.12A #1; click it to follow the splice. The trace of fiber 13 lists the splice as crossed #13→#1 and still ends at the camera cabinet's media converter.
2. A rolled pair
In the demo: at the Water Treatment Plant, a repair crossed fibers 85 and 86 between WT-WP.96A and WP-PW.96A: 85 goes to 86 and 86 to 85.
How the tool shows it: two lines form an X in tube 8. A circuit on that pair still traces correctly end to end. If the pair was crossed by mistake, select one fiber, Disconnect both, and Connect them straight; End A and End Z update as you go.
3. A mid-tube tap
In the demo: at the Library, fibers 5–6 of MH7-LB.24A are spliced to fibers 1–2 of the traffic-signal drop LB-TS2.12A, while the rest of that tube lands on the library's patch panel.
How the tool shows it: the tube header reads 2 spliced · 10 on panel, and the two tapped fibers carry ↪ badges. A → Z search treats the tapped fibers as part of the signal circuit's path, not as free library fibers.
4. Fibers coiled in a manhole for later
In the demo: in the MH7 splice case, only tube 1 of CH-MH7.48A continues to the library and four fibers drop to the traffic signal. The rest stay coiled in the case.
How the tool shows it: those rows read open, and the tube headers count them (4 spliced · 8 open). When a new lateral is built, splice it with Tube straight across, or select individual fibers and Connect.
5. Where the tool goes beyond the demo
The same rules cover the messier cases found in legacy records, without special handling:
- A fiber crossed between two different tubes at several locations. Each location is its own splice record, and the trace follows them in order, however many there are.
- A cable re-fed from the other direction. Cable A and Z ends are fixed. A splice can join any end, so the trace walks correctly whichever way the fiber was re-routed.
- Accidental loops. A path that comes back on itself is stopped and reported as Loop detected instead of running forever.
- Conflicting legacy records. When imported spreadsheets claim two splices on one fiber end, the importer refuses them (rule V4) and the Data health report lists them for field checking, rather than guessing.
- Mixed color standards or fiber counts. Tube and fiber colors are derived from the strand number, so a 288-count cable with 24 fibers per tube, or a 6-fiber drop, draws correctly with no extra setup.
Building and editing the network
Creating, changing and removing plant is done with the edit toolbar: the column of buttons on the map under Home. It appears in the Editor role. Plant is added the way it is built in the field: place the structures, lay conduit between them, pull cable through the conduit, then splice where cable ends meet. Every change is a single step that Undo reverses, is saved like any other edit, and is checked by .
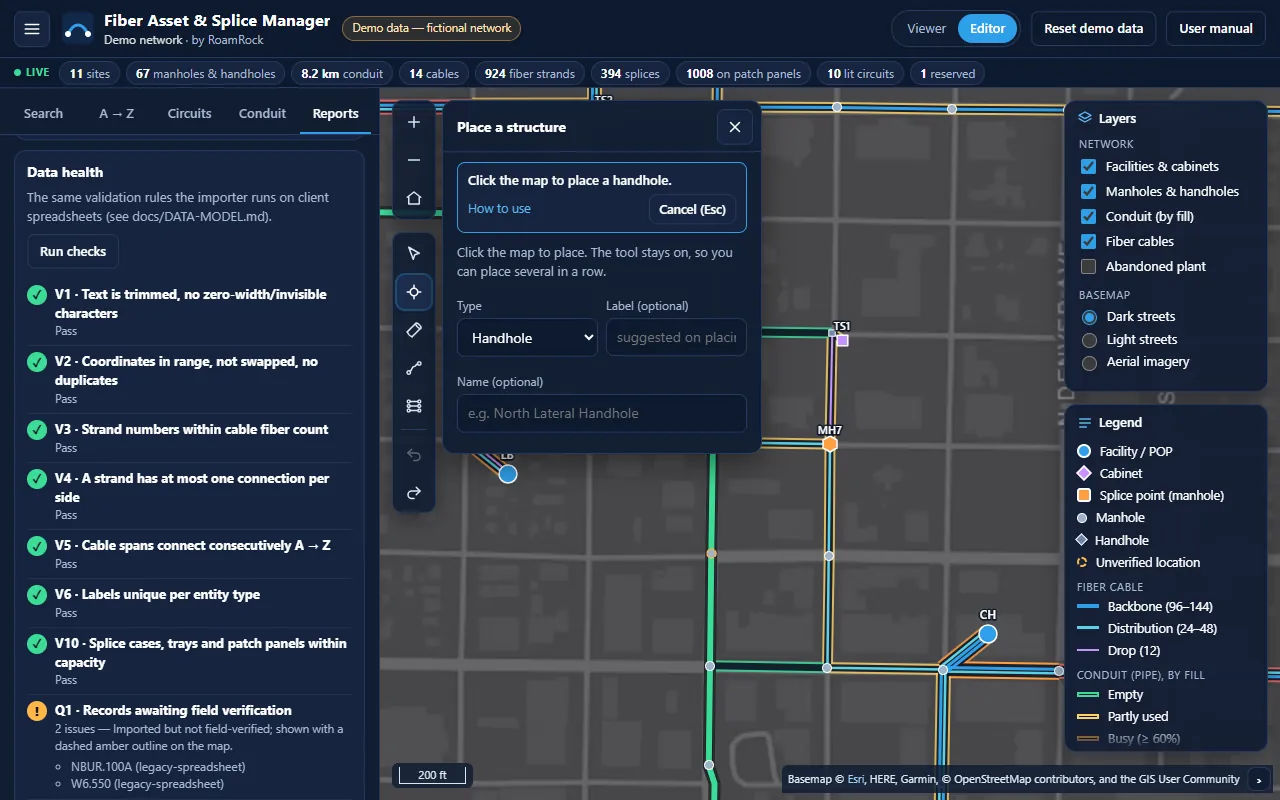
Clicking a tool opens its flyout beside the toolbar (a panel at the bottom of the screen on a phone). Click the tool again, the flyout's ×, or press Esc to put it away. While a tool is on, map clicks belong to it instead of opening pop-ups. When a tool is waiting for the map (placing, drawing, moving or reshaping), the top of its flyout says what to do next in one line, with How to use to unfold the details and the Cancel (and, where it applies, Done) buttons.
Placing a structure
To place a structure
- Click Place a structure in the edit toolbar.
- In the flyout, choose the Type: handhole, manhole, vault, pedestal, pole, cabinet or facility.
- Optionally type a Label (for a cabinet or facility, its Site code, such as
NS1) and a Name. - Click the map where the structure is. Keep clicking to place more; Esc or Cancel stops.
The structure appears on the map. An empty label is suggested from the naming conventions: a box near E12.400 becomes E12.400A, a cabinet CB1, a facility NS1. Cabinets and facilities get a rack.
Placing a structure on a conduit run
Click on a conduit to insert a handhole, manhole, vault, pedestal or pole into it. The structure lands exactly on the run, and the run is split in two at it: CD-042 now ends at the new structure, and a new run (for example CD-088) continues from it, with the same ducts and duct statuses. Cables in the run are not cut: they now pass through the new structure, with one more hop. The result offers Open a splice point on … for each of those cables, which turns the hop into a splice (see ). Cabinets and buildings sit beside the street, so they are never inserted into a run.
Laying conduit
To draw conduit along the street
- Click Lay conduit in the edit toolbar.
- In the flyout, choose the conduit: 2" HDPE with 3 innerducts, 4" PVC with 4, a 7-way microduct bundle, or a 2" PVC lateral with 2.
- Click a structure to start. The pointer snaps to structures as you get close.
- Click along the street at each bend.
- Double-click a structure to finish.
The conduit and its ducts are added, all spare. The status reads, for example, Added CD-088: 2" PVC lateral, 2 innerducts, 133 m, MH7 → NC1. A conduit that does not start and end on a structure is refused.
For a quick straight run, open Or a straight run between two structures, pick From and To, and click Add straight conduit. Lay conduit from here on a location card fills in From for you.
Pulling cable
To pull a new cable
- Click Pull cable in the edit toolbar, then click the A end and the Z end on the map (or pick From (A end) and To (Z end) in the flyout). The location card buttons Pull cable from here and Pull cable to here fill these in too.
- Choose the fiber count (12 to 144) and, if you like, the cable type.
- Leave land every fiber on a new patch panel ticked to terminate the cable at a building or cabinet end.
- Click Show route to see the conduit path on the map, then Pull cable.
The cable takes one spare duct in every conduit on the route, is labeled from its ends (for example MH7-NC1.12A), and its length includes 30 m of slack at each end. A summary lists what happened at each end, with a Splice it in at … button for every end where it meets other cables.
The route is the shortest one through conduit that still has a spare duct. If there is none, the route result says which conduit is full; lay conduit first.
At each end of the new cable:
| The end is at… | What the tool does |
|---|---|
| A building or cabinet | With the box ticked, adds a patch panel for this cable and lands every fiber on it, port N = fiber N (48 ports per panel). |
| A structure where other cables end | This is where cable ends meet, so they will be spliced. If there is no splice case yet, one is added with an empty tray: a rack-mount enclosure in a building or cabinet, a small dome case in a handhole, a larger case in a manhole or vault. |
| A structure where nothing else ends | Nothing; the fibers are left open (coiled) until something meets them. |
Splice cases, trays and tube routing
A splice case holds a fixed number of trays; a tray holds a fixed number of splices (12 or 24). Each tray also lists the buffer tubes routed to it: in the field a tube is laid into one tray, and its fibers are spliced there.
| Preset | Trays | Typical place |
|---|---|---|
| Dome splice case | 4 | Handhole or small manhole |
| Large dome / inline splice case | 12 | Manhole or vault |
| Rack-mount splice enclosure | 12 | Building or cabinet |
Use the Splice cases and trays tool: click a structure on the map (or pick it in the flyout; Add splice case / Add tray / case on a location card does the same) to add a case or a tray by hand. The panel lists each case with its trays and how full they are. Add tray is refused once the case holds all the trays it can: add another case.
In the splice editor, each tube header has a tray list showing where the tube is routed, for example → ST3 16/24. Choose another tray to move the tube, and its splices here move with it (the tubes they join to are routed there too). Add tray in the editor toolbar adds a tray to the case here, or a case if there is none.
New splices go where their tubes are routed. A tube pair always goes onto one tray together: a tray already holding both tubes, then one holding either, then an empty tray, then any tray with room. If none has room, a new tray is added while the case has space; otherwise the splice is refused with a message to add a case. The status line says when a tube was routed or a tray added, for example added tray W4.150.SC1.T2; routed MH7-NC1.12A T1 Blue to W4.150.SC1.T2.
Editing, moving and reshaping
Click Select and edit in the edit toolbar, then click a structure, conduit or cable on the map. (Edit / move / remove on a location card, cable card or conduit card opens the same form.) The flyout shows its details as a form, what is connected to it, and how it can be removed.
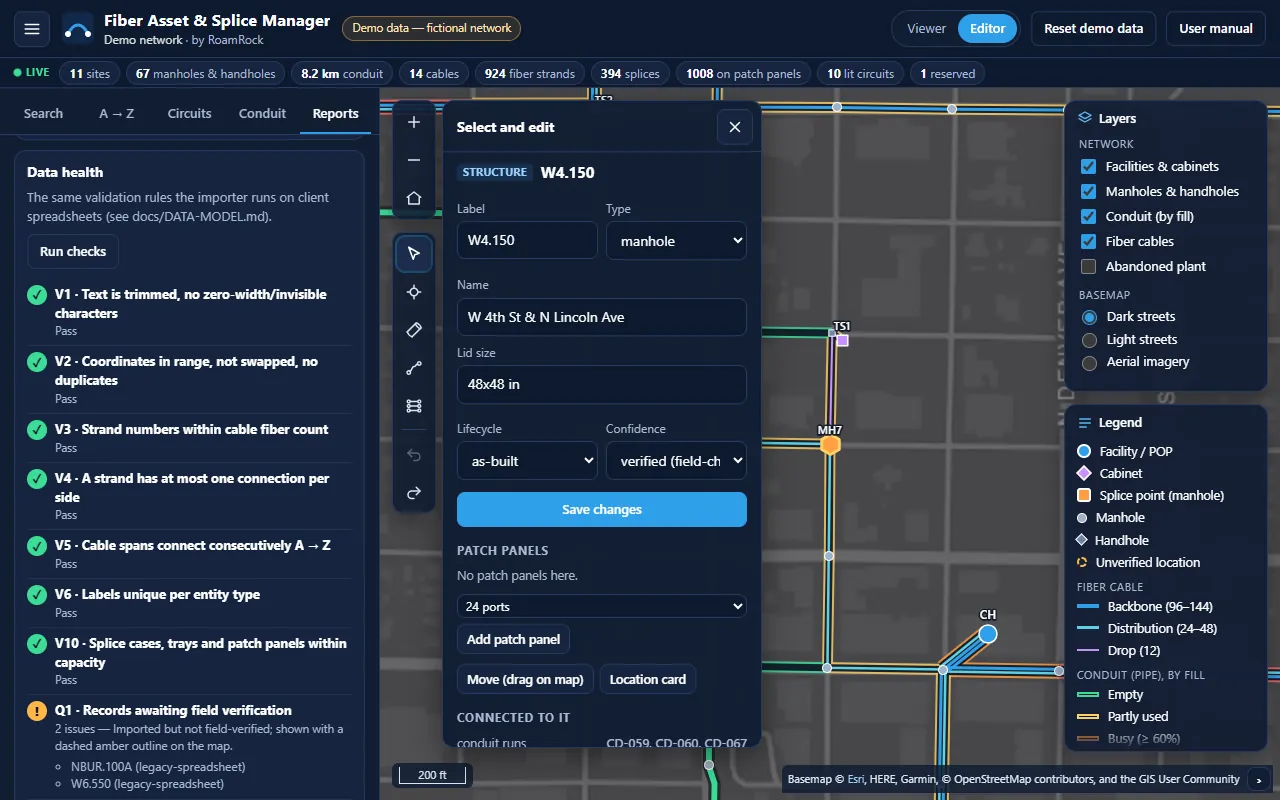
Click Save changes to apply the form. Labels must stay unique. An occupied duct's status is set by its cable and cannot be changed here. Setting Confidence to verified is how a field check is recorded: the record leaves the field-verification list in .
Patch panels
The edit flyout of a structure lists its patch panels under Patch panels: label, number of ports and how many fibers are landed on it (and the highest port in use).
| To | Do this |
|---|---|
| Add a panel | Pick the size (12 to 144 ports) beside Add patch panel and click it. The panel goes in the structure's rack (a building or cabinet without one gets R1 first) and is labelled by convention, for example PD.R1.PP5. It starts empty. |
| Rename | Type the new label in its row and press Enter or leave the field. Labels must stay unique. |
| Resize | Pick another size in its row. A panel cannot shrink below the highest port in use; move those fibers first. |
| Remove | Click × in its row. Only an empty panel can be removed: one with fibers landed or patch cords plugged in shows the button greyed out. Lift the fibers in the splice editor first. |
Fibers are landed on a panel's ports, and lifted off them, in the splice editor (see ). rule V10 also checks that no fiber sits on a port beyond its panel's size.
Rerouting a cable
A cable can be moved onto other conduit runs between the same two ends, for example around a damaged or full run. Its ends, splices and terminations do not change.
To reroute a cable
- Select the cable with Select and edit and click Reroute. Its current route is shown in green.
- Either click Suggest another route (the shortest route through conduit with a spare duct that avoids the current runs, or as many of them as possible), or click Pick runs on the map and click conduit runs one after another from the A end. Each run must start where the route has got to; click the last run again to take it back.
- When the route reaches the Z end, click Apply reroute.
The cable rides the new runs. The ducts it left become spare; in each new run it takes a spare duct (a run it stays in keeps its duct). Its length is recalculated, keeping the slack at its two ends. Undo puts it back.
A run with no spare duct cannot be used: add a duct to it (conduit edit form) or pick another run.
Change history
The edit flyout of every structure, conduit and cable ends with its History: each change, newest first, with what changed (for example name E 12th St → Main St manhole), when and who made it. A structure's history includes its patch panels, splice cases and splices (as counts: 12 splices added); a conduit's includes its ducts; a cable's shows reroutes. The last line says since when, and from which source, the record has been on file. Show all lists more than the last eight changes.
The history is saved with your edits in the same place (this browser in the demo; see ) and survives a reload; Reset demo data clears it. Each entry records who made the change: in the demo that is the demo editor; when sign-in is added, the signed-in user's name fills the same field.
Abandoning and deleting
Plant that exists, or existed, is abandoned, not erased, so the record keeps its history:
- Abandon marks it out of service. It disappears from the map, routes and fiber searches, and stays on record. Turn on Abandoned plant in Layers to see it (dotted gray), and Restore to service brings it back.
- Delete removes a record completely. It is only for mistakes: records still planned, or created in this session. For anything else the button is disabled.
Both are refused while something still depends on the record, and the message says what:
| Removing a… | Is refused while… | Deleting it also removes… |
|---|---|---|
| Structure | conduit runs, cables, splices, terminations or devices are attached (abandon or move those first) | its empty racks, splice cases, trays and patch panels |
| Conduit | a cable is in it | its ducts |
| Cable | a circuit (lit or reserved) rides on it: release or move the circuit first | its spans, splices and patch-panel terminations (and panels installed only for it); its ducts become spare again |
The Connected to it list in the flyout shows these dependencies before you try. Every abandon, restore and delete is one Undo step.
Opening a splice point mid-cable
Most splicing happens where cable ends meet. The exception is a mid-span access: tapping fibers out of a cable that passes straight through a manhole or handhole without a splice.
To open a splice point on a passing cable
- With the Splice cases and trays tool, click the structure on the map, or click Splice into a passing cable on its location card.
- Under the case details, click Open a splice point on … for the cable, and confirm.
The cable is split here into two cables, for example CH-PD.144A becomes CH-W2.200.144A and W2.200-PD.144A. A splice case is added if needed, and every fiber is spliced straight across, two buffer tubes per tray. Click Open the splice editor here to see the express lines.
Nothing changes end to end: every circuit on the cable still traces through, with one more splice in its loss budget. To tap fibers, select one, Disconnect it, and splice it to the new cable. The A-side cable keeps its record, so circuits and the A end are untouched. Records at the far end move to the Z-side cable. One Undo reverses the whole split.
Worked example: a new camera lateral
- Place a cabinet
NC1near the MH7 manhole. - Lay conduit from MH7 to NC1: a 2" PVC lateral with 2 innerducts.
- Pull cable MH7 → NC1, 12 fibers. NC1 gets a patch panel with all 12 fibers on it; MH7 already has a splice case, so it is ready to splice.
- Click Splice it in at MH7. The splice editor opens with
CH-MH7.48Aon the left and the new cable on the right. - Pick T3 Green → T1 Blue and click Tube straight across. The 12 splices go onto a new tray with both tubes routed to it.
- Select fiber 1 of the new cable: End A is City Hall's patch panel, End Z is NC1's. Trace or reserve it like any other fiber.
Trace and OTDR
A trace shows the complete path of a fiber from End A to End Z, every cable and splice in between, the totals and the loss budget. It is also where you record an OTDR or power-meter result.
Starting a trace
Start a trace from any of these:
- a fiber chip in the Fibers grid of a cable card;
- a circuit in the Circuits tab, in search results or under Fiber service at this location (the circuit's first strand is traced);
- a fiber chip #n in an A → Z route;
- Trace or Show full trace on map in the splice editor;
- End-to-end trace under Guided scenarios.
Reading the trace view
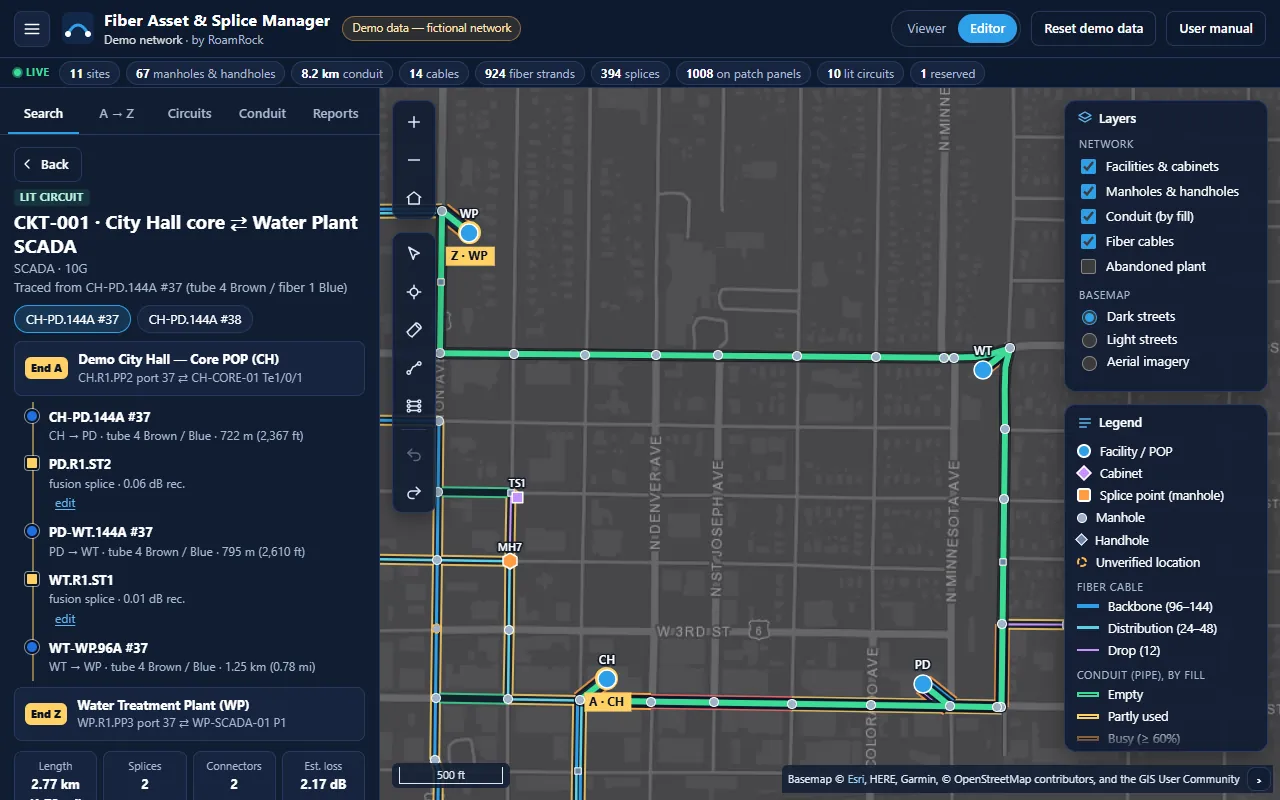
The map highlights the path in green (lit), amber (reserved) or yellow (dark), marks every splice location with a dot, and tags the ends A · … and Z · ….
Totals and the loss budget
The length is the sum of the cable lengths on the path, including slack loops. The estimated loss uses the formula in . Expand Loss assumptions to see the calculation, for example:
0.35 dB/km at 1310 nm × 2.770 km = 0.97 dB · 0.1 dB per fusion splice · 0.5 dB per connector pair. Length includes slack loops. Recorded splice losses on this path total 0.10 dB.
The recorded splice losses are the values technicians entered for each splice. They are listed for comparison and are not part of the estimate.
Recording an OTDR or power-meter result
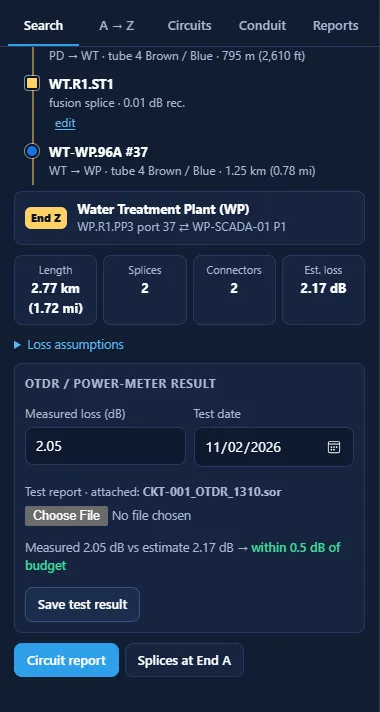
To record a test result
- Trace the fiber or circuit you tested. You need the Editor role.
- Under OTDR / power-meter result, type the Measured loss (dB), for example
2.05. - Enter the Test date. If you leave it empty, today's date is used.
- Optionally choose the Test report file (
.sor,.pdf,.csv,.txtor.json). - Click Save test result.
The message Test result saved. appears, and the form compares the measurement with the estimate.
| Field | Description |
|---|---|
| Measured loss (dB) | End-to-end loss, 0 to 60 dB, two decimals. Results are recorded at 1310 nm. |
| Test date | Date of the test. |
| Test report | The test file. Once saved, the label shows attached: file name. |
| Comparison | Measured x dB vs estimate y dB → within 0.5 dB of budget, or investigate: differs by more than 0.5 dB. |
NoteThe demo stores the name of the test file, not the file itself; the message says so when you attach one. Your name is recorded as the technician. For a circuit, the result belongs to the circuit and appears in the circuit report; for a dark fiber it belongs to the traced path.
TipA measurement more than 0.5 dB above the estimate usually points to a bad splice, a dirty connector or a tight bend. Use the splice hops and their recorded losses to decide where to look first.
A → Z dark fiber and reservations
The A → Z tool finds dark fiber that already runs, through existing splices, between two sites, and lets you reserve it for a future circuit.
Finding dark fiber routes
To find dark fiber between two sites
- Click the A → Z tab.
- Choose the start site in Location A and the end site in Location Z. Use the swap button between them to exchange A and Z.
- Click Find routes.
The routes are listed under n routes A → Z, and the first route is highlighted in yellow on the map.
The location lists contain every site with a site code, shown as code — name. You can also fill them from a location card with Use as A and Use as Z.
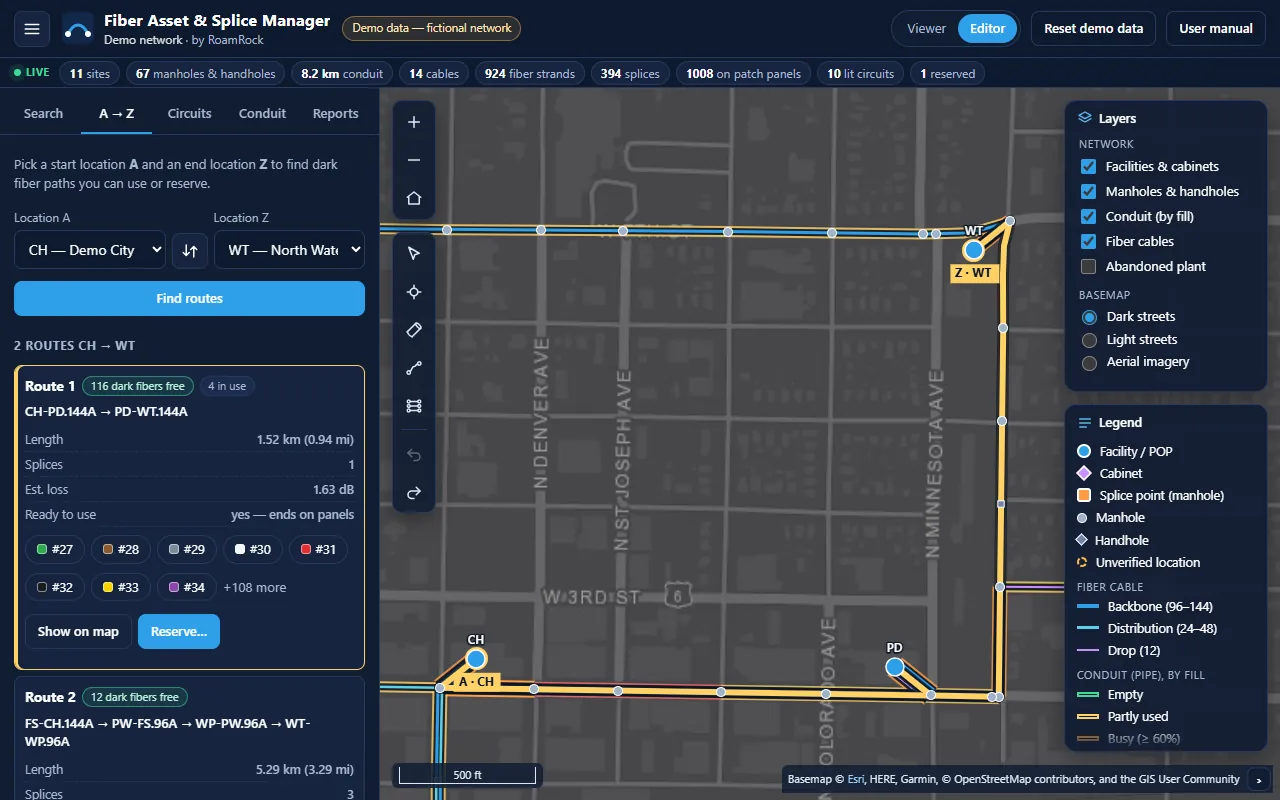
If A and Z are the same, the panel asks you to Pick two different locations. If no fiber connects the two sites through existing splices, the panel says so and suggests opening the splice editor at an intermediate location to build the path.
Reading the route results
Fibers are grouped into routes: all fibers that follow the same sequence of cables. Routes with free fibers come first, then those that are ready to use without opening splices, then the shortest.
Express splices and “Ready to use”
A dark fiber can pass through A or Z on an express splice and continue to another site. Such a fiber does reach both sites, but to use it between A and Z the splice at the end of the route must be opened so the fiber ends there.
The route card tells you how many express splices would need opening for its best free fiber. When you reserve, the application opens them for you, and the reservation's notes record it (Opened n express splice(s) at the route ends.). The reservation form also warns about it before you confirm.
Reserving fiber
To reserve dark fiber on a route
- Find the routes (see ). You need the Editor role.
- On the route you want, click Reserve….
- In Reserve fiber path, check the route summary and fill in the form (see the table below).
- Click Reserve. To abandon the reservation, click Cancel or press Esc.
A new reserved circuit is created, for example Reserved CKT-012: Future: CH ⇄ WT, and its trace view opens. The reserved fibers turn amber in the splice editor and fiber grids.
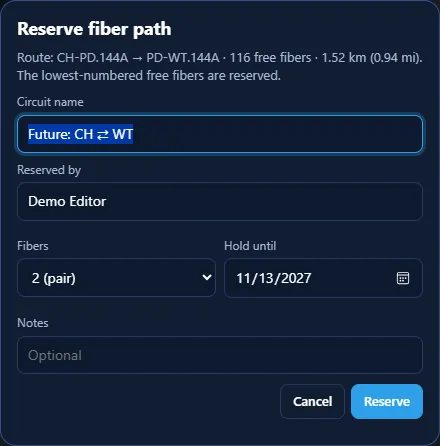
| Field | Description |
|---|---|
| Summary | The route's cables, number of free fibers and length, and whether express splices will be opened. |
| Circuit name | Required, up to 80 characters. Suggested: Future: A ⇄ Z. |
| Reserved by | Required, up to 60 characters. |
| Fibers | 1, 2 (pair) (default) or 4. The lowest-numbered free fibers are reserved. |
| Hold until | Required. Defaults to one year from today. |
| Notes | Optional, up to 160 characters. |
A new reservation gets the next circuit number, the service Reserved capacity, today's date as reserved on, and the owner Demo City IT. If the route has fewer free fibers than requested, the message Not enough free fibers on this route. appears and nothing is reserved.
Releasing a reservation
To release reserved fiber
- Open the reserved circuit, for example from the Circuits tab with the Reserved filter.
- Click Release reservation (Editor role).
- Confirm Release reservation … ? The fibers become available again. with OK.
The circuit is removed, the message CKT-… released. appears and the Circuits tab opens.
CautionReleasing removes the circuit only. Express splices that were opened when the fiber was reserved stay open. To restore them as well, use Undo on the reservation instead (in the splice editor, during the same session), or re-splice them in the splice editor.
Circuits
The Circuits tab lists every circuit on the network.
The Circuits tab
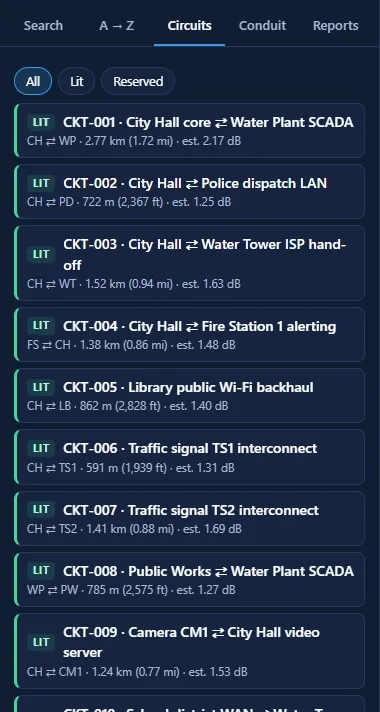
Use the filter chips All, Lit and Reserved to narrow the list. Each circuit shows:
- a status tag (lit in green, reserved in amber) and a matching colored edge;
- the label and name, for example CKT-005 · Library public Wi-Fi backhaul;
- End A ⇄ End Z site codes, length, estimated loss, and for reservations the hold-until date.
Click a circuit to open its trace view, with the circuit report and test result. The list updates as soon as you reserve or release fiber.
Circuits in the demo network
| Circuit | Name | Service | Status |
|---|---|---|---|
| CKT-001 | City Hall core ⇄ Water Plant SCADA | SCADA, 10G | lit |
| CKT-002 | City Hall ⇄ Police dispatch LAN | Public safety LAN, 1G | lit |
| CKT-003 | City Hall ⇄ Water Tower ISP hand-off | Internet transit, 10G | lit |
| CKT-004 | City Hall ⇄ Fire Station 1 alerting | Public safety LAN, 1G | lit |
| CKT-005 | Library public Wi-Fi backhaul | Public Wi-Fi, 1G | lit |
| CKT-006 | Traffic signal TS1 interconnect | Traffic, 1G | lit |
| CKT-007 | Traffic signal TS2 interconnect | Traffic, 1G | lit |
| CKT-008 | Public Works ⇄ Water Plant SCADA | SCADA, 1G | lit |
| CKT-009 | Camera CM1 ⇄ City Hall video server | Video, 1G | lit |
| CKT-010 | School district WAN ⇄ Water Tower ISP | Internet transit, 10G | lit |
| CKT-011 | Future: Public Works ⇄ City Hall diverse path | SCADA (future), 1G | reserved |
Open conduit finder
The open conduit finder answers “can we pull a new cable from here to there without building conduit?” It finds the shortest conduit route between two structures on which every conduit still has a free duct.
Finding open conduit
To find open conduit between two structures
- Click the Conduit tab.
- Choose the From structure and the To structure. Both lists contain every structure, shown as label — name.
- Click Find open conduit.
A banner gives the answer, the conduit runs are listed in order, and the route is drawn on the map.
TipInstead of scrolling the lists, click a structure on the map and use Conduit from or Conduit to in its popup or location card. The tab opens with the structure filled in and the message Set as conduit search “From”. (or “To”).
Reading the results
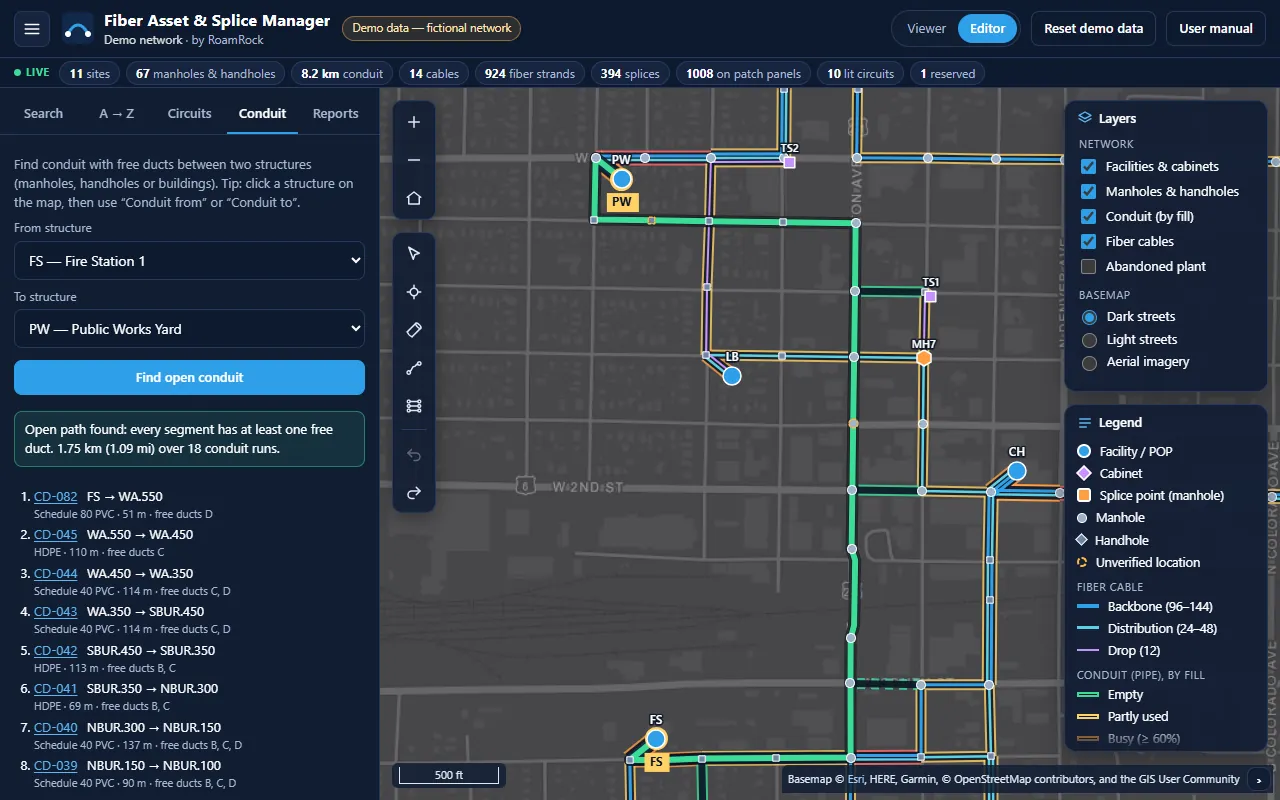
| Result | Meaning |
|---|---|
| Green banner | Open path found: every segment has at least one free duct. with the total length and number of conduit runs. |
| Red banner | No continuous open path. The shortest conduit route is shown anyway; red segments are full and need new conduit or innerduct. |
| Run list | Each conduit in order: label (click to open the conduit card), from → to, material, length, and free ducts A, B… or full, plus planned for planned conduit. |
| Map | Green segments have a free duct, red segments are full, dashed segments are planned. |
Only ducts with status spare count as free; reserved and damaged ducts do not. Abandoned conduit is never used. If the two structures are the same, the panel asks you to Pick two different structures.; if no conduit connects them at all, it says These structures are not connected by conduit.
Reports and CSV export
The Reports tab produces printable reports, splice diagrams and map books for crews, spreadsheet (CSV) and GIS (GeoJSON) exports, and runs the data health checks.
The Reports tab
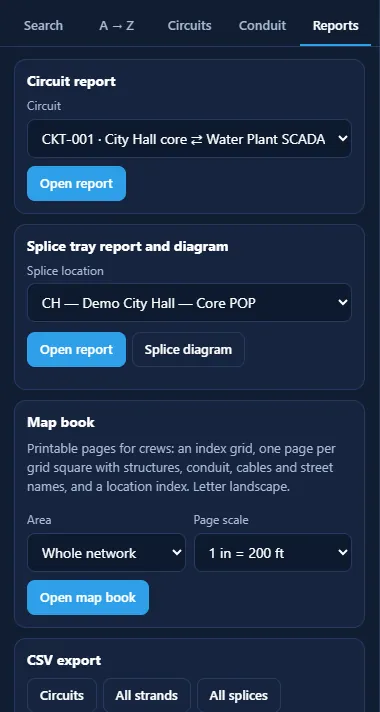
The circuit report
Open it from the Reports tab, from Circuit report in a trace view, or from Guided scenarios.
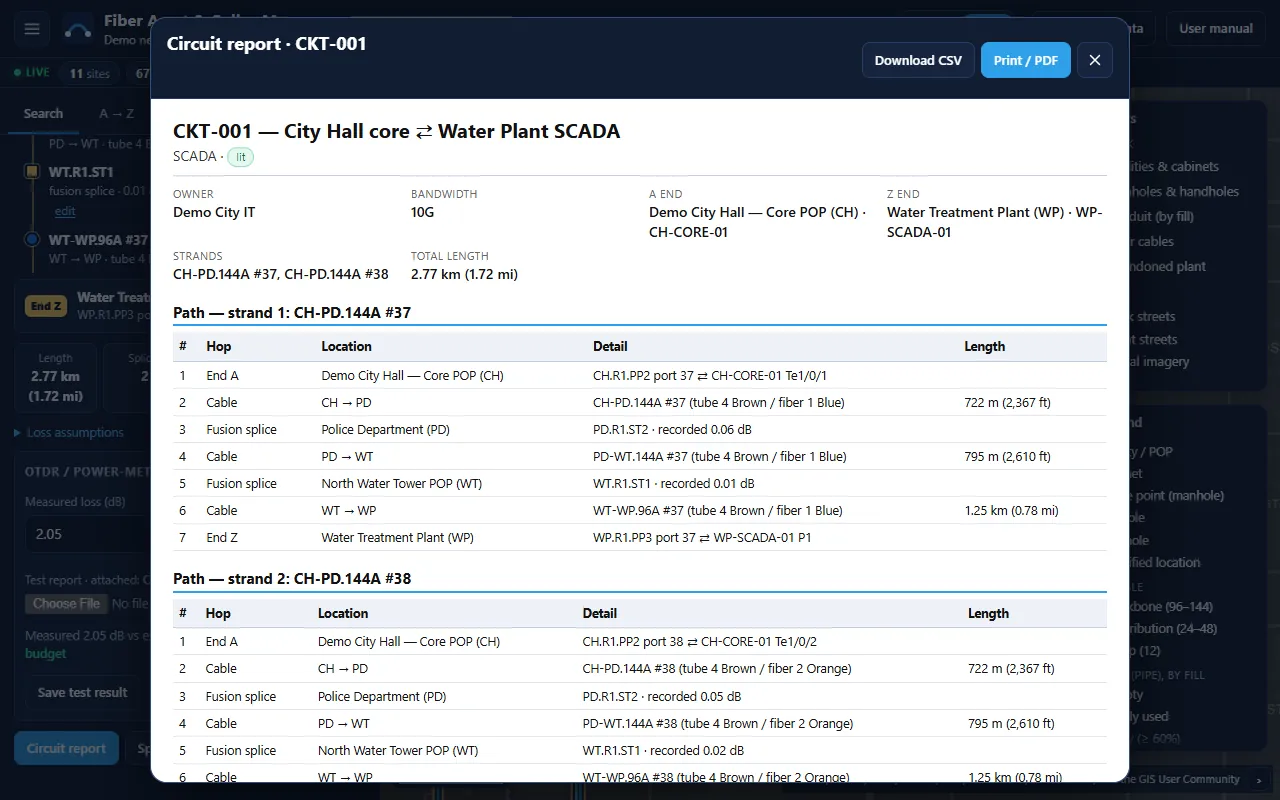
The report contains:
- the circuit label, name, service and status;
- owner, bandwidth, A end and Z end (with the device), strands, total length, and for reservations who reserved it, when, until when, and notes;
- a Path table for each strand: every hop with its type (End A, Cable, Fusion splice, Mechanical splice, End Z), location, detail and length;
- the Loss budget table: fiber attenuation, splices and connector pairs, the estimated total, and the measured OTDR value if one is recorded;
- the OTDR test: measured loss, wavelength, date, technician and report file, or No test recorded yet.;
- signature lines for Tested by, Date and Approved, and a footer with the date and time it was generated.
Download CSV saves the path tables as CKT-###-circuit-report.csv with the columns circuit, strand, hop, type, location, detail, length.
The splice tray report
Open it from the Reports tab or from Splice report on a location card.
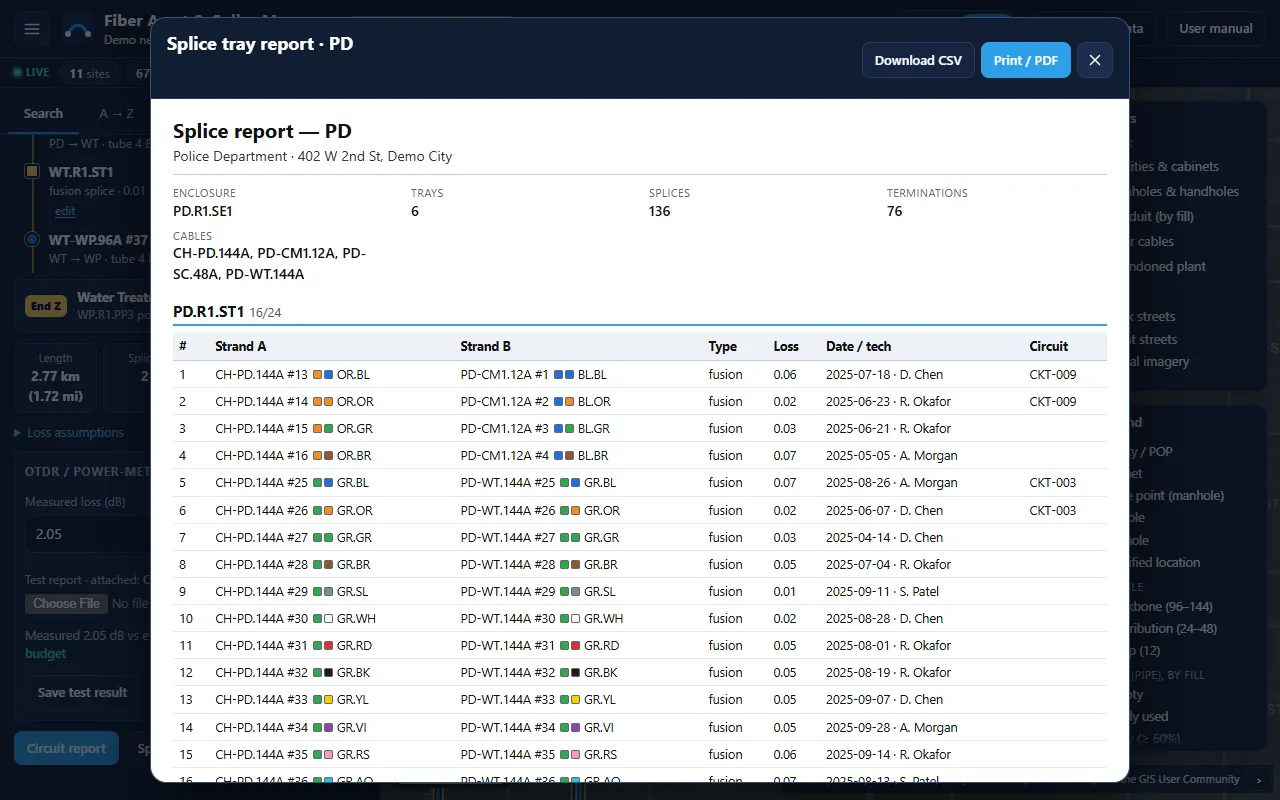
The report lists the enclosure, the number of trays, splices and terminations, and the cables. Then, for each tray, every splice in strand order with strand A and strand B (label, tube and fiber color swatches and code), type, loss, date and technician, and circuit. For each patch panel, every port with its strand, what it is patched to and the circuit.
Download CSV saves the splices as <location>-splice-report.csv with the columns location, tray, strand_a, code_a, strand_b, code_b, kind, loss_db, date, technician, circuit.
The splice diagram
A printable drawing of one splice location for the crew working in it. Open it with Print diagram in the splice editor, Splice diagram on a location card, or Splice diagram on the Reports tab.
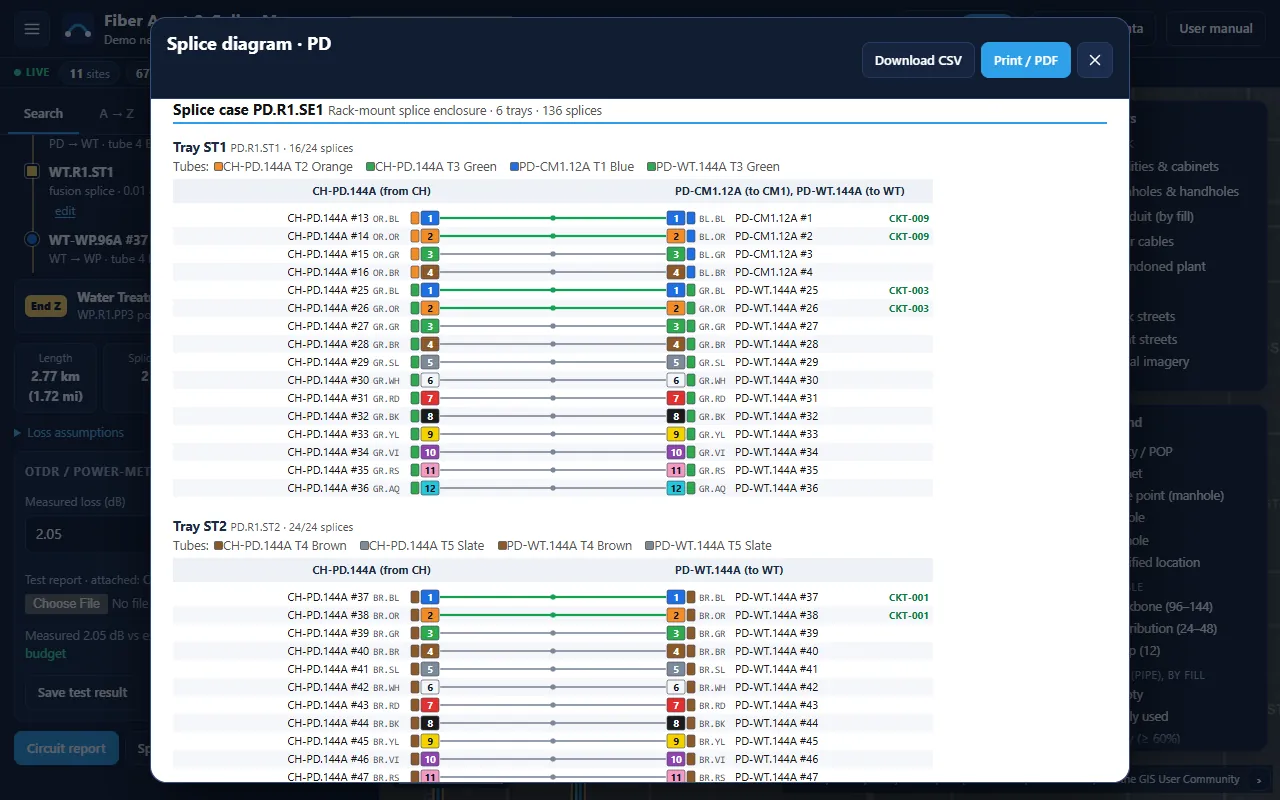
It contains:
- the location: label, name, address, latitude and longitude, lid size, and the number of splice cases, trays, splices and panel terminations;
- Cables here: each cable with its type, fiber count (tubes × fibers per tube), which end is here (Z end = coming in, A end = going out), the other end, and how many of its fibers are spliced, on a patch panel or open here;
- for each splice case, each tray as a diagram: fibers coming in on the left, fibers going out on the right, one line per splice. Each fiber shows its label, its colour code (tube.fiber), its tube colour and its fiber colour with its number in the tube. A line that changes height is a fiber that changes position (a rolled pair or a tube moved to another). Green lines are lit circuits, dashed amber are reserved, gray are spliced but dark; a dot marks a fusion splice and a square a mechanical one. The circuit label is at the right. The tray heading lists the buffer tubes routed to it. A tray of more than 36 splices continues in a second block;
- each patch panel: every port in use, with its fiber, colour code, what it is patched to and the circuit;
- the TIA-598 colour code (1 Blue to 12 Aqua) and signature lines for Spliced by, Date and Checked.
It prints on the printer's normal page (portrait), each tray kept whole on a page. Download CSV saves one row per splice as <location>-splice-diagram.csv: location, case, tray, in_strand, in_code, out_strand, out_code, kind, loss_db, circuit.
The map book
A set of printed map pages a crew can take into the field. On the Reports tab, pick the Area and the Page scale, then click Open map book.
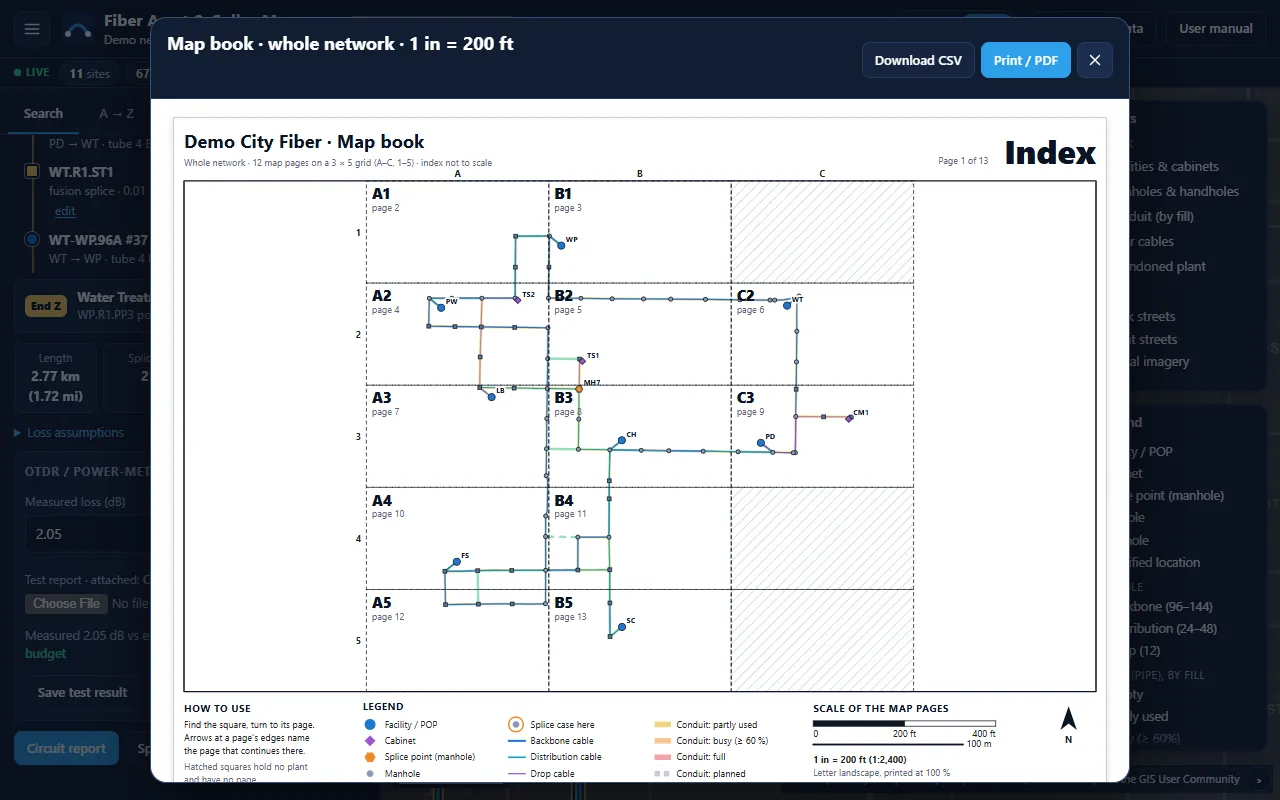
- Area: Whole network, or Current map view (zoom the map to the area first).
- Page scale: 1 in = 100, 200, 400 or 800 ft. The area is cut into a grid of squares, one printed page each, at that scale. Columns are lettered from the west (A, B, C …) and rows numbered from the north (1, 2, 3 …), so a square is named like B3. Squares with no plant get no page.
- Page 1 is the index: the whole area with the grid on it, each square named with its page number, and the legend.
- Each map page shows one square: facilities, cabinets, manholes and handholes with their labels (site names too), splice cases ringed in orange, conduit coloured by fill, cables by type with their labels, and street names. Arrows at the edges name the page that continues on that side. Under the map: a key map with this square highlighted, the legend, a scale bar in feet and metres, the scale and a north arrow.
- The book ends with a location index: every structure (sites first, then by label) and the square it is on.
The book prints on Letter paper in landscape: print it at 100 % (no "fit to page") and the scale bar is true. Abandoned plant is included only when Abandoned plant is on in the Layers panel. The map pages are drawn from the network itself, without the basemap, so they print sharp in colour or gray and need no internet connection. Download CSV saves the location index (location, name, type, page, lat, lon).
NoteA map book is limited to 150 pages. For a big network, choose a smaller scale (more feet per inch) or print the current map view.
Printing and saving a report as PDF
To print a report or save it as PDF
- Open the report.
- Click Print / PDF.
- In the browser's print dialog, choose a printer, or choose Save as PDF (or Microsoft Print to PDF) as the destination.
Only the report is printed, on white pages, without the map, the sidebar or the report buttons. Long reports run over as many pages as they need. The map book prints in landscape; everything else uses the printer's normal page.
Close the report with the × button or Esc.
CSV exports
Click a button in the CSV export card to download the current data, including your changes. The message Exported n … rows. confirms the download. File names start with the organisation name from the top bar (demo-network in the demo).
| Button | File | One row per · columns |
|---|---|---|
| Circuits | demo-network-circuits.csv | Circuit: label, name, service, status, a_end, z_end, strands, length_m, est_loss_db, otdr_db, reserved_by, reserved_until |
| All strands | demo-network-strands.csv | Strand of every cable: strand_id, cable, strand, tube, tube_color, fiber, fiber_color, code, status, circuit, end_a, end_z, path_length_m |
| All splices | demo-network-connections.csv | Splice: id, location, tray, strand_a, strand_b, kind, loss_db, date, technician, status, source |
| Conduits | demo-network-conduits.csv | Conduit: label, from, to, material, size_in, length_m, ducts, occupied, reserved, spare, lifecycle, cables |
| Structures | demo-network-structures.csv | Structure: label, type, site_code, name, address, street, lat, lon, lid_size, cable_ends, splices, panel_terminations, lifecycle, confidence, source, updated_at, updated_by |
| Cables | demo-network-cables.csv | Cable: label, type, fiber_count, tubes, fibers_per_tube, fiber_type, a_end, z_end, length_m, conduit_runs, route, lit, reserved, installed_year, lifecycle, confidence, source |
NoteCSV files are UTF-8 with a byte-order mark, so Excel shows the ⇄ and — characters correctly when you double-click the file.
GeoJSON export
The GeoJSON export card downloads the network as map layers for a GIS (QGIS, ArcGIS Pro, or any web map): Structures (points), Conduits and Cables (lines), or All three in one file with a layer property. Coordinates are WGS 84 longitude/latitude (the GeoJSON standard). Each feature carries the record's details (label, type, lifecycle, confidence, source, last update) and a few derived values: cable ends and splices at a structure, duct fill and cables in a conduit, the A and Z ends and conduit runs of a cable.
Shapefiles and Esri file geodatabases are exported and imported with the administration tools rather than in the browser; see .
Data health
Data health runs the same validation rules in the browser that the importer runs on client spreadsheets, so you can check the network at any time, including after your own edits.
Running the checks
To check the data
- Click the Reports tab.
- In the Data health card, click Run checks.
Each rule is listed with a green ✓ (Pass), an amber ! (warning) or a red ✕ (error), the number of issues, and up to five examples.
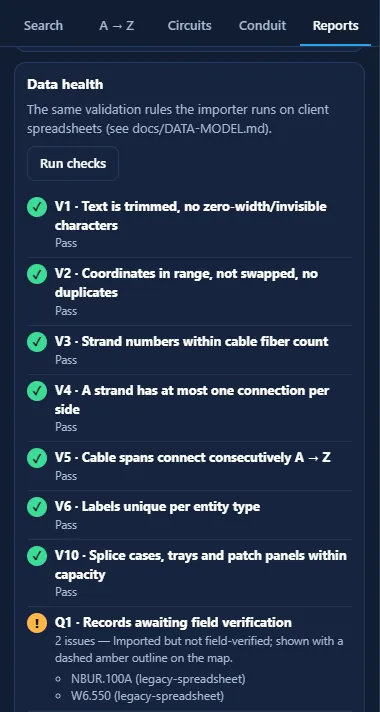
The rules
| Rule | Checks that… |
|---|---|
| V1 | Text is trimmed, with no zero-width or other invisible characters. |
| V2 | Coordinates are in range, not swapped (inside the project area), and no two structures share the identical point. |
| V3 | Strand numbers are within the cable's fiber count, and tubes × fibers per tube equals the fiber count. |
| V4 | A strand has at most one connection (splice or termination) per side at a structure. |
| V5 | Cable spans connect one after another from the A end to the Z end. |
| V6 | Labels are unique for each kind of record. |
| V10 | No splice case holds more trays, and no tray more splices, than its capacity; every routed tube belongs to a real cable. |
| Q1 | Lists records awaiting field verification (warning, not an error). In the demo: NBUR.100A and W6.550. |
The importer runs three more rules that need the original files: V7 (every reference resolves), V8 (a splice or termination is at a structure where the strand's cable has an end) and V9 (a duct holds at most one cable and its status matches). See .
Acting on the results
- Q1 is a work list: send a crew to check each listed structure, then update its confidence to verified in the source data.
- Errors in V1–V6 come from the source data, not from the editor: the splice editor prevents V4 problems as you work. Correct the source records and re-import.
Keyboard shortcuts
Every function can be reached with the keyboard. Use Tab and Shift+Tab to move between controls.
Application
| Key | Action |
|---|---|
| ? | Open this user manual in a new tab (not while typing in a field). |
| ← → | In the sidebar tab bar: move to the previous or next tab. |
| Esc | Close the open dialog: splice editor, report, or reservation form (cancels the reservation). |
| Shift + drag | Zoom the map to a box. |
Splice editor
| Key | Action |
|---|---|
| ↑ ↓ | Previous or next fiber in the column. |
| ← → | Same row in the other column. |
| Home End | First or last fiber in the column. |
| Space / Enter | Select or deselect the focused fiber. |
| C | Connect. |
| D / Delete | Disconnect. |
| T | Trace in the information panel. |
| U / Ctrl+Z | Undo. |
| Esc | Close the editor. |
This manual
| Key | Action |
|---|---|
| / | Put the cursor in the search box. |
| Enter | In the search box: go to the first result. |
| Esc | Clear the search, the result list and the highlighted words. |
Administration
This chapter is for the administrator who installs the application. It is a static web application: plain HTML, CSS and JavaScript files with no build step and no server code for the demo and static modes.
Files and folders
| Path | Contents |
|---|---|
index.html | The application page. |
manual.html, assets/manual/ | This manual and its screenshots. |
config.json | Data mode, data URL, API base and storage key. |
web.config | IIS settings: MIME types, default document, caching, security headers. |
assets/css/app.css | Styles, including the print stylesheet for reports. |
assets/js/ | util, store (data model, trace, edits, storage adapters), map (OpenLayers), splice, reports, ui, app (start-up). |
assets/data/ | demo-network.json and a .js copy used when the page is opened from disk. |
docs/ | DATA-MODEL.md and IMPORT-MAPPING.md. |
schema/ | fiber-model.schema.json (JSON Schema of the network file). |
templates/ | Blank CSV import templates with example rows. |
tools/ | Python tools: demo generator, CSV importer, model library, end-to-end test, manual screenshots. |
Deployment modes (config.json)
config.json sits next to index.html and selects how data is loaded and saved:
{
  "mode": "demo",
  "dataUrl": "assets/data/demo-network.json",
  "apiBase": "api/",
  "storageKey": "fiberDemo.edits.v1",
  "orgName": "Demo network",
  "demoBadge": true
}| mode | Loads from | Saves to | User and role |
|---|---|---|---|
demo | dataUrl | This browser's local storage: a snapshot of the edits and an audit log (operation, user, time; last 200 entries). | Viewer/Editor switch in the top bar; Reset demo data shown. |
static | dataUrl | Nothing: a read-only viewer of a published network file. | Always Viewer. The top bar shows Viewer · viewer (read-only). |
rest | GET {apiBase}network | POST {apiBase}changes, one request per change. | GET {apiBase}me returns { name, role }; if it fails, the user is Anonymous, Viewer. |

static mode: no role switch and no reset; the user and role are shown instead.| Key | Default | Description |
|---|---|---|
mode | demo | demo, static or rest. Any other value means demo. |
dataUrl | assets/data/demo-network.json | The network file for demo and static. Use a relative URL. |
apiBase | api/ | Base URL of the REST API for rest. |
storageKey | fiberDemo.edits.v1 | Local storage key for demo edits. Change it to give a second copy of the demo its own saved state. |
orgName | the network's name | The organisation line under the product name in the top bar, for example the client's city. An empty string hides it. Without the key, the name stored in the network file (meta.name) is used. |
demoBadge | false | true shows the Demo data — fictional network badge. Only the public demo sets it. |
basemapLabels | true | false drops the basemap's street and place-name labels (the light basemap becomes a label-free gray). The public demo uses this so its fictional city never shows a real town's name; a real deployment keeps the labels. |
Noteconfig.json is optional. When the page is opened straight from disk (file://) the browser cannot read it, and the defaults above (demo mode) apply. The network data then loads from assets/data/demo-network.js.
Deploying on IIS as a drop-in folder
To install on an existing IIS site
- Copy the folder into any folder or virtual directory of the IIS site, for example
\\server\wwwroot\gis\fiber\. At a minimum copyindex.html,config.json,web.configandassets/; addmanual.htmlto include this manual. Every path is relative, so the folder name does not matter. - Keep the included
web.config(see ). - Edit
config.json:staticfor a read-only map of a network file you publish, orrestonce the API exists. Forstatic, replaceassets/data/demo-network.jsonwith your network file, for example the output of the importer. - Browse to the folder, for example
https://server/gis/fiber/.index.htmlis the default document.
TipAny static web server works the same way. The automated test serves the application from a nested path (/gis/apps/fiber/) to prove it runs from any subfolder.
web.config reference
| Setting | Purpose |
|---|---|
| MIME types | Serves .json, .geojson, .csv and .js with the right type and UTF-8. Older IIS versions refuse to serve .json without it. Each type is removed first so the file does not fail where the server already defines it. |
| Client cache | Static files are cached in the browser for 7 days. |
| No-cache locations | index.html, config.json and assets/data are always revalidated, so a new configuration or network file shows immediately. |
| Default document | index.html. |
| Headers | X-Content-Type-Options: nosniff and Referrer-Policy: strict-origin-when-cross-origin. |
| Compression | Static compression on. |
Updating the application
Because scripts and styles are cached for 7 days, each <script> and stylesheet tag in index.html carries a version, such as app.js?v=1.0. When you replace JavaScript or CSS files, increase that number in index.html so browsers fetch the new files. index.html itself is never cached.
To publish a new network file, replace the file named by dataUrl. It is not cached, so users get it on the next page load. In demo mode, saved browser edits made against the previous file are then ignored.
Identity and Windows Authentication
The Viewer/Editor switch exists only in demo mode and is not security. In production the user's identity always comes from the host, never from the page:
- On an intranet, use IIS Windows Authentication (domain accounts), or put a sign-in provider (for example Entra ID / OpenID Connect) in front of the REST API.
- The API returns the user's name and role from
GET {apiBase}me, enforces the editor role onPOST changes, and records who made each change. - The page only shows the name and hides editing controls for viewers.
To use Windows Authentication with the rest mode
- In IIS Manager, select the application folder and the API, and open Authentication.
- Enable Windows Authentication and disable Anonymous Authentication on both.
- Set
"mode": "rest"inconfig.json.
The browser sends the user's credentials automatically with every API request.
NoteIn static mode no one can edit, so authentication only controls who may view the map. Enable Windows Authentication on the folder if the network data must stay internal.
Closed-network setup
Users' browsers need outbound access to:
cdn.jsdelivr.net— the OpenLayers map library (ol.jsandol.css, version 10.2.1);server.arcgisonline.com— the three basemaps.
To run without internet access
- Download
ol.jsandol.css(OpenLayers 10.2.1) and copy them intoassets/vendor/. - In
index.html, point the OpenLayers<link>and<script>tags atassets/vendor/ol.cssandassets/vendor/ol.js. - Point the basemap at your own tile or WMS service (the basemap sources are defined at the start of
M.initinassets/js/map.js), and bump the?v=ofmap.js.
Without a reachable basemap the network still draws on a plain dark background, and every tool works.
Where demo edits are stored
| Local storage key | Contents |
|---|---|
fiberDemo.edits.v1 | The working copy of splices, circuits, equipment (including trays added by the editor) and OTDR results for dark fibers, the version of the network file it belongs to, an audit log of the last 200 changes (operation, time, user), and the per-record change history of the last 2,000 changes (what changed, when, who). |
fiberDemo.role | The last role chosen with the Viewer/Editor switch. |
Each browser profile on each computer has its own copy. Reset demo data deletes the edits key.
The REST interface
All data access goes through one storage-adapter interface in assets/js/store.js (load(), save(change), reset(), identity(), readOnly). The rest adapter expects a server with three endpoints:
| Request | Description |
|---|---|
GET {apiBase}network | Returns the network in the canonical model (validates against schema/fiber-model.schema.json). |
POST {apiBase}changes | Receives one change per edit: op (label, added and removed connections and circuits, OTDR result) and a timestamp. The server validates it with the data model rules, stamps the user from the authenticated request, and returns 200, or 409 with the conflicts. |
GET {apiBase}me | Returns { "name": "…", "role": "viewer" | "editor" } from the host's authentication. |
All requests are sent with credentials. If the server rejects a change, the user sees Server rejected the change (status). Reload to resync.
Data model and import
This chapter summarizes the canonical network model that client data is mapped into, and how to import it. The full references are docs/DATA-MODEL.md and docs/IMPORT-MAPPING.md; the machine-readable definition is schema/fiber-model.schema.json (JSON Schema 2020-12).
Design principles
- One structure table. Every place you can stand is a structure with a point: facility/POP, manhole, handhole, vault, pole, cabinet, pedestal.
- Containment, not columns. Racks, splice enclosures, splice trays and patch panels are equipment inside a structure, nested by parent (structure › rack › enclosure › tray, or structure › rack › patch panel).
- Pathways are separate from cables. A conduit runs between two structures and holds ducts; a cable occupies one duct per span.
- Strands have stable IDs.
cableId:N. Tube and fiber color are derived;BL.ORis display, never a key. - Connections are first-class rows. Splices, terminations and jumpers are records. End-to-end paths are derived by tracing, never typed in.
- Circuits reference strands, not paths.
- Every record carries provenance: ID, label, lifecycle, source, confidence, created and updated by and when.
- Geometry is GeoJSON in WGS 84 (EPSG:4326). The source coordinate system is kept, and importers reproject on the way in.
Entities
| Entity | Key fields |
|---|---|
| structure | label, type, siteCode, name, address, street, lidSize, point geometry |
| equipment | label, type (rack, splice_enclosure, splice_tray, patch_panel), structure, parent, capacity, connector |
| device | label, type (router, switch, media_converter, server, battery_backup, olt, ont, radio, other), structure, rack, portCount, portPrefix |
| port (derived) | ownerId:N from panel capacity or device port count |
| conduit | label, from and to structure, material, sizeIn, color, placement, line geometry, lengthM |
| duct | label (CD-042.B), conduit, position, kind, color, sizeMm, status, reservedFor |
| cable | label, type, fiberCount, tubeCount, fibersPerTube, colorStandard, fiberType, A and Z structure, lengthM |
| cable_span | cable, seq, from and to structure, conduit, duct, lengthM, slackLoops, slackM |
| strand (derived) | cableId:N |
| connection | tray, structure, strand A, strand B, kind (fusion, mechanical, connector), lossDb, date, technician, status |
| termination | strand, structure, patch panel, port, connector, lossDb |
| jumper | port A, port B, structure, kind, lengthM |
| circuit | label, name, service, status, strandIds, A and Z end, owner, bandwidth, reservedBy/On/Until, notes, otdr |
| meta | name, modelVersion, crs, sourceCrs, colorStandard, colors, lossAssumptions, bbox |
Naming conventions
| Thing | Convention | Example |
|---|---|---|
| Facility / cabinet | Short site code | WT, CH, TS1 |
| Manhole / handhole | StreetCode.Block (direction letter + street + block; suffix A, B on collision) | E12.400, W2.350, NBUR.100A |
| Splice point in a manhole | Site code for cable labels; the label stays | MH7 (W4.150) |
| Rack | Site.R# | WT.R1 |
| Splice enclosure | Site.R#.SE#; manhole case Box.SC# | WT.R1.SE1, E12.400.SC1 |
| Splice tray | Site.R#.ST#; manhole Box.SC#.T# | WT.R4.ST1, E12.400.SC1.T2 |
| Patch panel | Site.R#.PP# | WT.R1.PP2 |
| Conduit / duct | CD-### / CD-###.Letter | CD-042.B |
| Cable | A-Z.FiberCount+Letter | WT-CH.96A |
| Strand | Cable #N or TUBE.FIBER code | PD-WT.144A #37, BR.BL |
| Circuit | CKT-### | CKT-001 |
Internal IDs (st-0001, cb-0003, …) are never shown as the main name and never re-used, so labels can be renamed without breaking references.
Status values
| Field | Values |
|---|---|
| lifecycle | planned · as-built · abandoned (kept for history, excluded from routing) |
| confidence | verified · unverified · estimated |
| duct status | occupied · spare · reserved · damaged |
| connection status | planned · as-built · removed |
| circuit status | lit · reserved · planned · decommissioned |
CSV import templates
The templates/ folder has one blank CSV per entity, each with example rows. Rows refer to each other by label; the importer assigns the internal IDs. Import them in this order (each file only refers to labels from files before it):
| # | File | Columns |
|---|---|---|
| 1 | structures.csv | label, type, site_code, name, facility_kind, address, street, lat, lon, x, y, source_crs, lid_size, lifecycle, source, confidence, notes |
| 2 | equipment.csv | label, type, structure, parent, name, capacity, connector, lifecycle, source, confidence |
| 3 | devices.csv | label, type, name, model, structure, rack, port_count, port_prefix, lifecycle, source, confidence |
| 4 | conduits.csv | label, from_structure, to_structure, material, size_in, color, placement, length_m, wkt, lifecycle, source, confidence |
| 5 | ducts.csv | conduit, position, kind, color, size_mm, status, reserved_for, lifecycle, source, confidence |
| 6 | cables.csv | label, type, fiber_count, fibers_per_tube, color_standard, fiber_type, a_structure, z_structure, installed_year, lifecycle, source, confidence |
| 7 | cable_spans.csv | cable, seq, from_structure, to_structure, conduit, duct_position, slack_loops, slack_m |
| 8 | connections.csv | location, tray, cable_a, strand_a, cable_b, strand_b, kind, loss_db, date, technician, status, source, confidence |
| 9 | terminations.csv | location, panel, port, cable, strand, connector, loss_db, status |
| 10 | jumpers.csv | location, from_port, to_port, kind, length_m |
| 11 | circuits.csv | label, name, service, status, a_structure, a_cable, a_strands, a_device, a_device_port, z_structure, z_device, z_device_port, owner, bandwidth, reserved_by, reserved_on, reserved_until, notes |
TipStrand columns accept either a number (2) or a color code (BL.OR). Points can be given as lat/lon, or as x/y with their source_crs (state plane, UTM) to be reprojected. Conduit lines can be given as wkt; without it a straight line is drawn and marked estimated.
Mapping from legacy spreadsheets
A typical legacy fiber spreadsheet maps into the model as follows (full detail in docs/IMPORT-MAPPING.md). The first step of any import is a column-mapping pass onto the template headers.
| Legacy sheet | Becomes |
|---|---|
| facility | structures (type facility); ID becomes label and site code |
| access_box | structures (manhole, handhole, vault, pedestal); sizes such as 4x4 go to lid size |
| rack, rack_device | equipment (rack) and devices |
| splice_tray | equipment, split by type into splice enclosures, splice trays and patch panels |
| conduit, conduit_junction | conduits between pairs of structures; each delineator letter becomes a duct |
| cable | cables; start and end location become A and Z structure |
| cable_segment | cable spans; Splice and PATCH actions become connections and terminations |
| fiber | the color standard (meta colors) |
| fiber_patch | split into terminations, connections, jumpers and circuits; the free-text “next connection” is parsed, or entered in the splice editor |
| naming, street | conventions for labels; street names and codes on structures |
Every sheet is cleaned the same way: values are trimmed, invisible characters removed, non-breaking spaces replaced, text normalized; coordinates are range-checked and swapped latitude/longitude pairs repaired. Legacy rows default to confidence unverified until checked in the field.
Running an import
To import client CSV files
- Fill the templates (or export your data to the same headers) into one folder.
- Run the importer with the tools Python environment:
set PYTHONIOENCODING=utf-8 %LOCALAPPDATA%\roamrock-tools-venv\Scripts\python.exe tools\import_network.py <folder-with-csvs> out\network.json --source client-gis-2026 - Read
out\network.report.json: every fix, warning and error with its file and row number. - Fix the errors and run again until the importer exits without errors (it exits non-zero on errors, so it can gate a pipeline).
- To view the result, replace
assets/data/demo-network.json(or the file named bydataUrl) withnetwork.json.
Shapefiles and Esri file geodatabases are imported with import_gis.py, which turns them into the same templates and runs this importer; see .
Importing and exporting shapefiles and file geodatabases
tools\import_gis.py reads a folder of shapefiles or an Esri file geodatabase (.gdb folder), turns its layers into the template tables above, and runs the importer on them, so a GIS import gets the same cleaning, checks and report as a spreadsheet import.
%LOCALAPPDATA%\roamrock-tools-venv\Scripts\python.exe tools\import_gis.py client.gdb out\network.json --csv out\tables
%LOCALAPPDATA%\roamrock-tools-venv\Scripts\python.exe tools\import_gis.py shapefiles\ out\network.json| Layer | Expected as |
|---|---|
structures | A point layer. The point becomes lat/lon, or x/y with the layer's CRS when it is projected (reprojecting needs pyproj). |
conduits | A line layer. The line becomes the conduit's geometry. |
cables | Optional line layer; only its attributes are used (a cable's route comes from cable_spans). |
| the other templates | Attribute tables: a .dbf in the shapefile folder, or a table in the geodatabase, named like the template (cable_spans, connections, …). |
Layer names are matched without regard to case; field names exactly, without regard to case, or by their first ten characters (shapefiles cut field names to ten, so from_structure arrives as from_struc). Fields that match no template column are listed and skipped. A client's own geodatabase will use its own names: rename them to the templates in a copy first.
tools\export_network.py network.json out\ writes the reverse: the template CSVs, GeoJSON, a shapefile folder and network.gdb. tools\test_gis.py runs the whole round trip on the fictional demo network and checks nothing is lost. The GIS tools need pyshp and pyogrio in the tools Python environment; the browser application needs neither.
Troubleshooting and FAQ
The map is blank or shows an error
- The map library could not load (offline?). Reload when connected. — the browser could not reach
cdn.jsdelivr.net. Check the internet connection or proxy, or host OpenLayers locally (see ). - Could not load the network data. Check config.json (mode / dataUrl / apiBase). — the network file or API could not be read. Check that
dataUrlpoints to an existing file, that the server serves.json(keepweb.configon IIS), or that the API answers inrestmode. - The network draws but the background is plain dark — the basemap tiles are blocked. Every tool still works.
Editing buttons are grayed out
- You are in the Viewer role: click Editor in the top bar (demo mode).
- In
staticmode the application is read-only for everyone. - In the splice editor, Connect needs one fiber selected on each side, Disconnect and Trace need a selected fiber, and Undo needs a change made in this session.
- Tube straight across and All straight across need two cables; they are disabled where only one cable ends.
There is no Splice editor button
The button appears only for structures with a splice enclosure. Plain manholes and handholes on the conduit route have none; cables pass through them without splices.
My changes are gone
- Someone clicked Reset demo data in this browser.
- You are using a different browser, browser profile or computer: demo edits are stored per browser.
- The browser's site data was cleared, or the window was private.
- A new network file was published; edits made against the old file are not loaded.
Connect says “Conflict”
One of the fibers is already spliced or terminated at this location, or both fibers are in the same cable. Read the status line, which names the fiber and its current partner, disconnect it first, then connect again. See .
A → Z finds no route
A → Z only follows splices that already exist. If no fiber runs between the two sites, build the path: open the splice editor at each intermediate location and splice a tube or fibers through, then search again. Choose sites on the same ring to see results quickly.
The measured loss is far from the estimate
The estimate uses fixed assumptions (see ). A difference of more than 0.5 dB is flagged investigate. Check the recorded splice losses on the trace, connector cleanliness at both ends, and whether the measurement was at 1310 nm.
The printed report includes the map, or is empty
Use the Print / PDF button in the report window rather than the browser's own print command with no report open. The print layout shows only the open report.
The map is rotated
Holding Alt+Shift while dragging, or twisting two fingers on a touch screen, rotates the map. Reload the page to return to north-up.
Can I open the application straight from disk?
Yes. Double-click index.html. The data loads from the .js copy, config.json is not read (demo mode applies), and the browser still needs internet access for the map library and basemap. This manual also works from disk.
Glossary
Terms
| Term | Definition |
|---|---|
| A end / Z end | The two ends of a cable or circuit. For a cable, set by its label (A-Z); for a trace, End A and End Z are where the fiber finally ends in each direction. |
| Abandoned | Lifecycle of a record kept for history only; not used for routing. |
| As-built | Lifecycle of a built, in-place asset. |
| Backbone | High-count cable (96–144 fibers) forming the ring between facilities. |
| Basemap | The background map under the network: dark streets, light streets or aerial imagery. |
| Buffer tube | A colored tube in a cable that holds a group of fibers, usually 12. |
| Cable span | One structure-to-structure section of a cable's route, in one duct. |
| Circuit | A service carried on one or more strands, labelled CKT-###. |
| Conduit | A pipe or bundle between two structures, containing ducts. |
| Confidence | How far a record can be trusted: verified, unverified or estimated. |
| Connector pair | A mated pair of connectors, for example at a patch-panel port. Counted once per end that lands on a panel. |
| Crossed splice | A splice between strands with different numbers, for example #13 to #1. |
| Dark fiber | A strand with no circuit on it. |
| Distribution cable | Medium-count cable (24–48 fibers) branching from the ring. |
| Drop cable | Low-count cable (12 fibers) to a cabinet or a single building. |
| Duct | An innerduct or microduct inside a conduit, identified by a position letter. |
| Express splice | A splice where a fiber continues through a site to the next cable without being dropped. |
| Facility / POP | A building with network equipment; POP = point of presence. |
| Fill | The share of a conduit's ducts that are occupied. |
| Fusion splice | A splice made by melting two fibers together; 0.1 dB in the loss budget. |
| Handhole | A small below-grade pull box. |
| Identify | Clicking a map feature to see its popup. |
| Jumper | A patch cord between a patch-panel port and a device port. |
| Lit | Carrying a live circuit. |
| Loss budget | The expected end-to-end optical loss of a path, from length, splices and connectors. |
| Manhole | A below-grade vault on the conduit route. |
| Mechanical splice | A splice made by aligning fibers in a clamp; 0.3 dB in the loss budget. |
| OTDR | Optical time-domain reflectometer: a test instrument that measures the loss along a fiber. |
| Patch panel | Rack equipment with connector ports where strands are terminated. |
| Planned | Lifecycle of a designed but not yet built asset; dashed on the map. |
| Reservation | A circuit with status reserved: fibers held for a future use until a date. |
| Site code | The short code of a facility, cabinet or splice point, used in cable labels. |
| Slack loop | Extra cable coiled in a structure for future splicing; included in cable length. |
| Splice enclosure | The case or rack unit that holds splice trays. |
| Splice tray | A tray in an enclosure holding individual splices (for example 24). |
| Strand | A single fiber, identified by cable and number. |
| Structure | Any point location in the network: facility, cabinet, manhole, handhole and so on. |
| Termination | A strand landed on a patch-panel port. |
| TIA-598 | The fiber and tube color code standard: blue, orange, green, brown, slate, white, red, black, yellow, violet, rose, aqua. |
| Trace | Following a strand through its splices to both ends. |
| Unverified | Imported but not yet checked in the field; dashed amber outline on the map. |