
Case study · Our own product
Fiber Asset & Splice Manager
Fiber network GIS for cities, utilities, campuses and ISPs
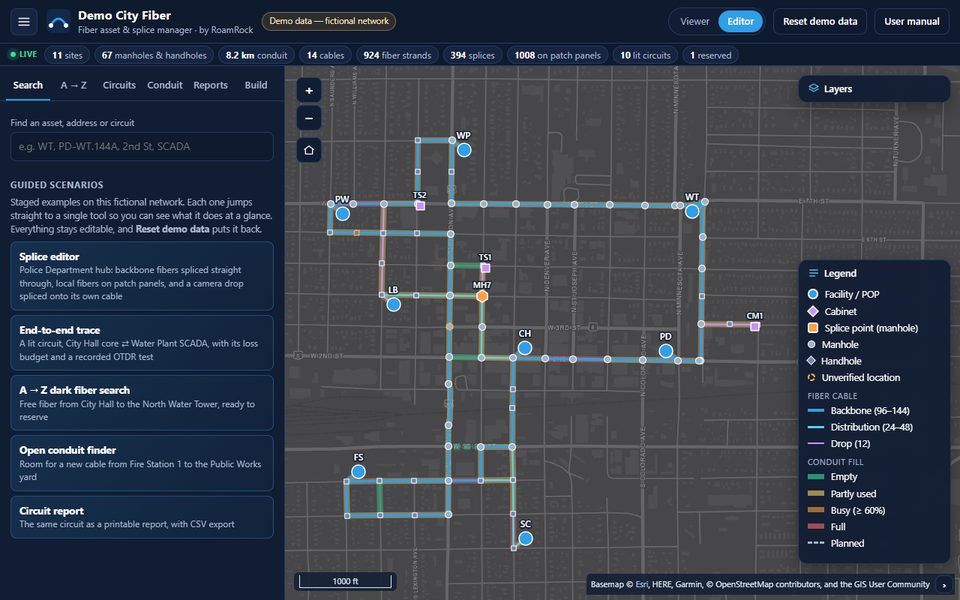
Fiber records usually live in spreadsheets, drawings and the memory of whoever pulled the cable. When a line is cut or a new circuit is needed, nobody can quickly say which fiber goes where, or what is still free. We built one live record of the whole plant: structures, conduit, cables, every strand and splice, and the circuits they carry, on a map anyone on the team can open.
What it does
- The map. Facilities, cabinets, manholes and handholes, conduit colored by how full it is, and cables by type, with layer switches, a street, dark or imagery basemap, a legend and identify pop-ups.
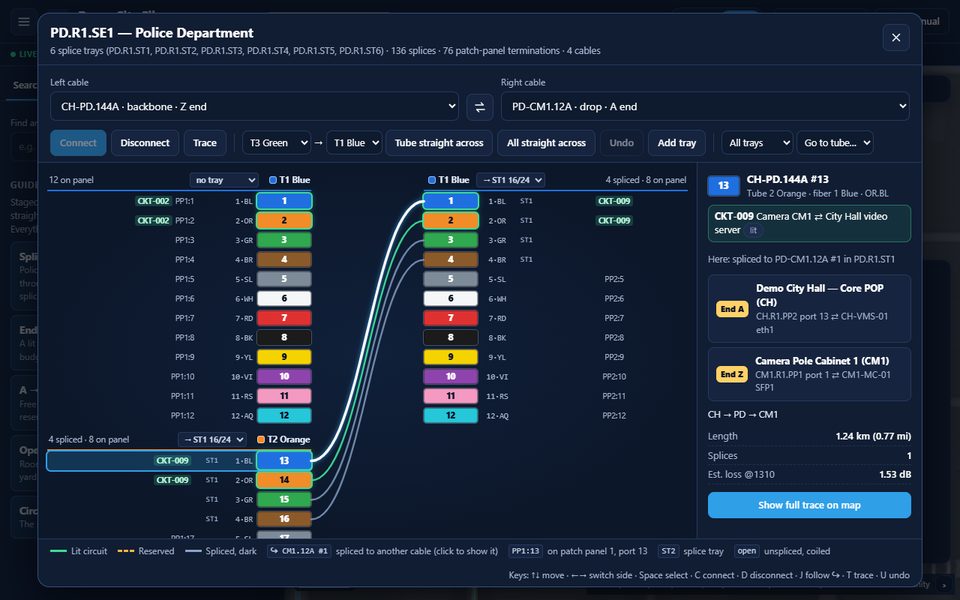
- The splice editor. Two cables side by side with tubes and fibers in the TIA-598 color code. Drag a fiber onto its partner, or click one on each side and connect; splice a whole tube straight across, or every fiber at once. Each tube is routed to a splice tray in a splice case of fixed size, as in the field, and fibers can be landed on or lifted off patch-panel ports. Undo, conflict checks and a warning before a lit circuit is broken. It works from the keyboard, and on a phone in the field with thumb-sized rows.
- Building the network. Place manholes, handholes, cabinets and buildings on the map, draw conduit along the street, and pull new cable through conduit with a free duct. Fibers land on a new patch panel at a building; where cable ends meet, a splice case is added, ready to splice. A cable passing through a manhole can be opened for a mid-cable splice without breaking its circuits.
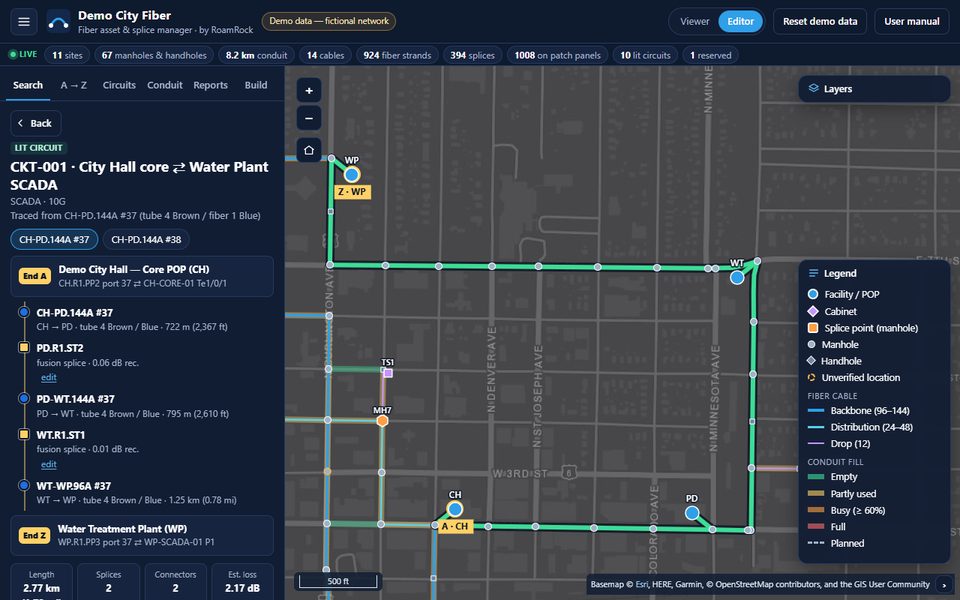
- End-to-end trace. Pick any fiber to see End A and End Z down to the device port, every hop highlighted on the map, the total length, a loss budget with its assumptions stated, and the measured OTDR result beside it.
- Dark fiber, A to Z. Choose two locations and get the routes through existing splices with their free fibers, length and estimated loss, then reserve fibers for a future circuit.
- Open conduit. Find a path between two structures where every segment still has a free duct, before planning a new pull.
- Search and reports. Find any asset, address, street, cable or circuit; a location card lists the circuits serving a site and the free fibers on each cable there. Circuit and splice-tray reports print cleanly, and every list exports to CSV. Printable splice diagrams for every case and tray, and map books (an index grid, one page per square) for field crews.
Your data, in a model that holds it
Underneath is a documented data model for fiber plant: structures, equipment, conduit and ducts, cables and their spans, strands, splices, terminations, jumpers and circuits, and on every record where it came from and whether it has been checked in the field. Blank import templates cover each part, and the importer cleans what it is given and reports what it found. A network that is only partly documented is still useful on day one, and gets more complete as technicians verify it.
How it's built
A static web app on OpenLayers, with no build step and no server code to
install. It runs as a drop-in folder on the client's own web server, such as
IIS on Windows, from any subfolder, with the file types and caching set by an
included web.config. One setting chooses how it gets its data:
the demo saves edits in the browser, a read-only viewer shows a published
network file, and a server API mode is laid out for shared editing against
the client's own database. Who is signed in comes from the server, for
example Windows sign-in on a city network, never from the page itself.
Pricing
One price to get your network in, one price a year after that, with no per-user fees. Setup depends on the state of your records:
- $7,500: clean digital data, already keyed and related
- $12,500: digital data that needs cleaning up, keying and relating before import
- $16,000: mixed sources, such as spreadsheets, PDFs and scanned drawings
Then $6,000 a year for the app, updates, backups and support, for unlimited users. Your data is always yours: export it at any time as shapefile, GeoJSON or CSV. Paper-only records or field verification are quoted after a look at what you have.
Status
A working demo on a fictional city network, drawn over a real street grid so it looks like the real thing. Everything in it can be tried: build, splice, trace, reserve, report, then reset it to start again.
Downloads
- Product cut sheet (PDF, 1 page)
- Demo walkthrough (PDF, 3 pages): a 10-minute guided tour